Launch economics
India’s $13,302-per-kg launch estimate uses capacity, not payload flown
A new dataset ranks India highest among six major launching regions in 2025. Its result divides estimated flyaway costs by vehicles’ maximum LEO capacity, leaving prices, mission budgets and actual payload masses outside the measure.
Add us as a preferred source on Google Add us as a preferred source on Google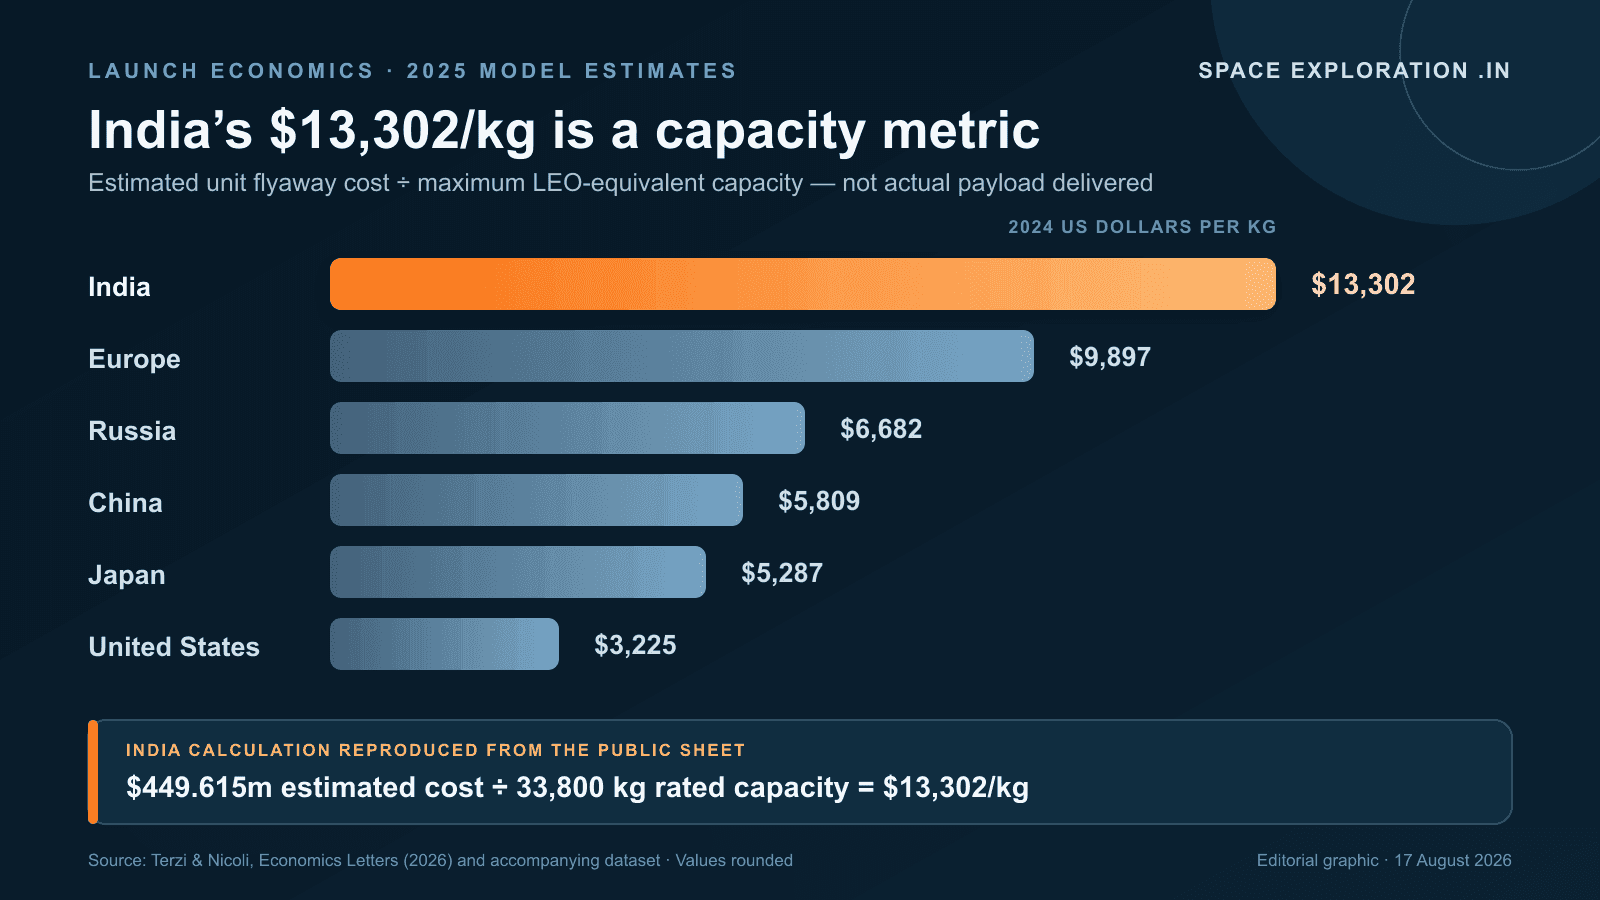
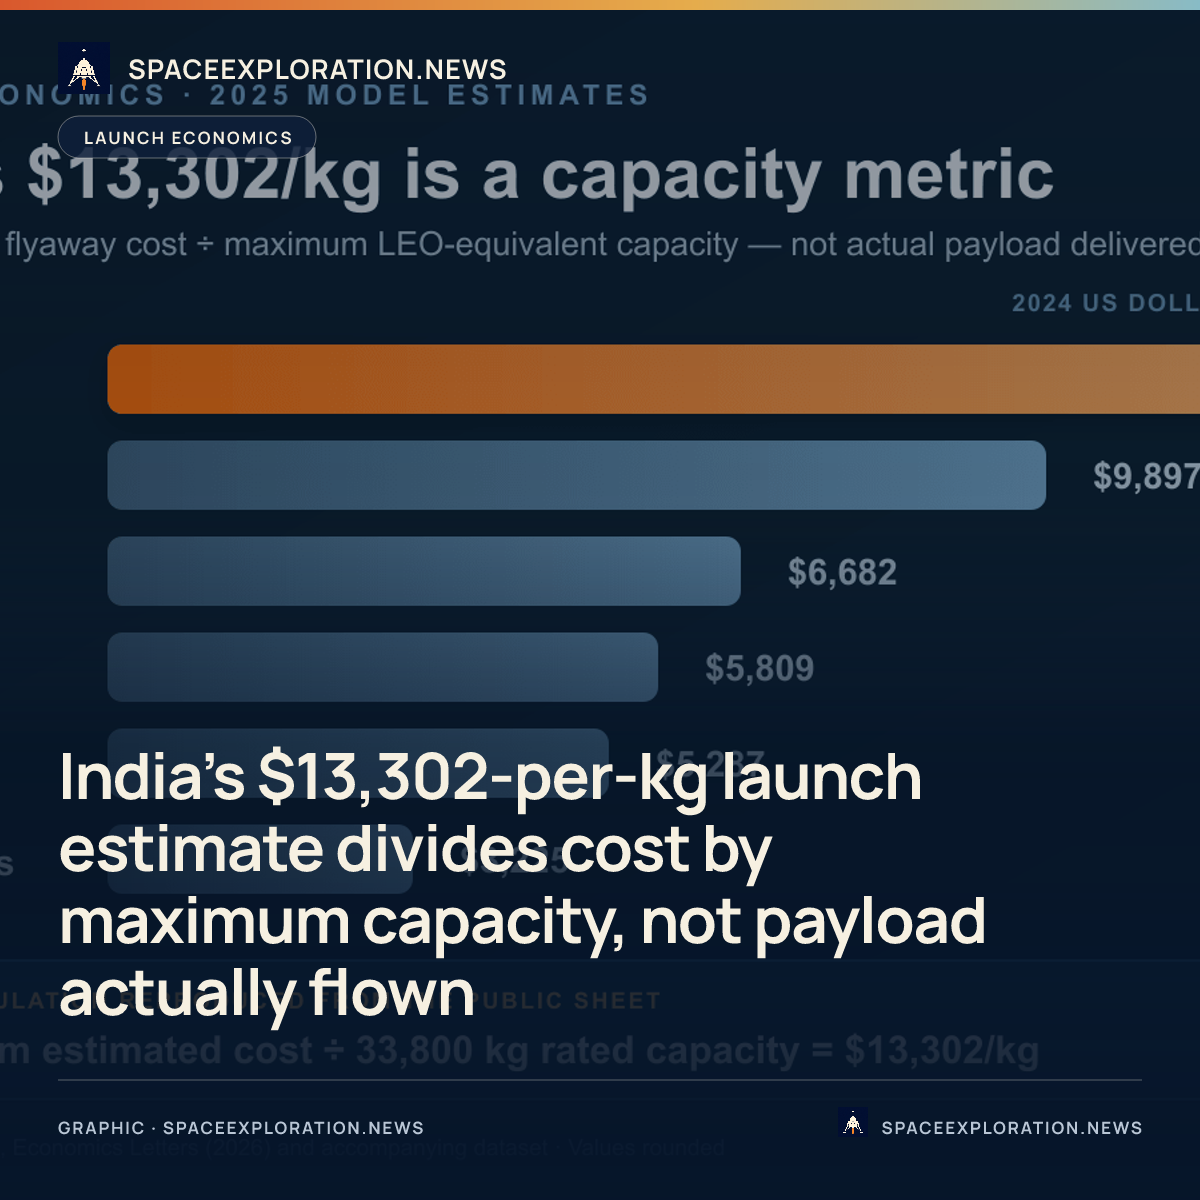
A new Economics Letters paper estimates that Indian rockets cost $13,302 per kilogram of low Earth orbit capacity in 2025, the highest figure among six major launching regions in its comparison. That result is not an account of the payload India actually carried or the prices customers paid. It is a modelled ratio: estimated unit flyaway costs divided by the maximum LEO-equivalent capacity of the vehicles counted in the year.
The paper, by Alessio Terzi and Francesco Nicoli, draws on a public dataset covering 6,740 launches from 1960 through 2025 across 16 geographical entities. Its 2025 estimates, all expressed in 2024 US dollars, put Europe at $9,897 per kilogram, Russia at $6,682, China at $5,809, Japan at $5,287 and the United States at $3,225. The India figure drew wider attention in an August 14 report by The Hindu and a linked discussion on Reddit.
How the $13,302 is built
The authors define unit flyaway cost as the direct and indirect cost of manufacturing a launch-ready vehicle, including overhead, recurring engineering, tooling support and quality control. They explicitly exclude the research and development cost of designing the vehicle. They also convert costs to 2024 dollars and vehicle performance to an LEO equivalent, allowing unlike rockets and destinations to enter one table.
The India calculation can be reproduced from the downloadable spreadsheet. It counts two GSLV Mk II flights at an estimated $131.355 million each and 5,000 kilograms of LEO capacity per flight; two LVM3 flights at $67.0625 million and 10,000 kilograms each; and one PSLV-XL flight at $52.78 million and 3,800 kilograms. The numerator is therefore $449.615 million and the denominator 33,800 kilograms. Dividing one by the other gives $13,302.22 per kilogram, which the paper rounds to $13,302.
This arithmetic resolves the apparent conflict with India’s reputation for frugal missions. A launcher can have a lower total cost than a much larger vehicle and still return a higher cost per kilogram because its fixed cost is spread across less rated capacity. A spacecraft mission budget, meanwhile, can include the spacecraft, instruments, ground segment and operations. Neither comparison answers the paper’s narrower question about the estimated recurring cost of launch capacity.
The denominator is capacity, not cargo
The spreadsheet does not divide by the mass actually delivered on each mission. Its annual mass field is the number of flights multiplied by each configuration’s maximum LEO-equivalent capacity. A lightly loaded launch and a fully loaded launch therefore contribute the same denominator when they use the same vehicle. The result is best read as estimated full-capacity efficiency for the year’s fleet mix, not the realised cost of transporting the payloads that flew.
That distinction became the main methodological question in the public discussion linked to The Hindu’s report, where Reddit users asked whether scale and larger launchers were driving the result. The comments are not evidence that the ranking is wrong, but inspection of the spreadsheet confirms the premise behind the question: maximum capacity, rather than manifested payload, sets the weight. Capacity is a defensible variable for an experience-curve study, yet it answers a different question from cost per kilogram delivered.
The choice is consequential outside India too. The 2025 US rows include five Starship 2.1 entries, each assigned 115,000 kilograms of maximum capacity and a $103.1 million flyaway cost. Together they add 575,000 kilograms to the US denominator and enter the average at about $897 per kilogram. The authors’ related PNAS Nexus paper describes Starship at that point as an advanced prototype. Counting prototype capacity can be consistent with a study of technological production experience, but it should not be mistaken for a record of operational cargo delivered.
The cost inputs carry their own uncertainty. The authors compiled government reports, academic papers and public documentation; they identify Encyclopedia Astronautica as their most frequent historical source and say that, where configuration data were missing, they sometimes substituted a cost from the closest rocket in the same family. Those choices are disclosed in the companion methodology, but they mean a precise national point estimate inherits the uncertainty and comparability limits of mixed public sources and imputations.
Cadence matters twice
Cadence first affects the annual average through composition. The public sheet contains five Indian flights and 198 US flights for 2025. A high flight count does not automatically reduce cost per kilogram, because the result also depends on which vehicles fly, their assigned costs and their rated capacities. Repeated flights of a low-cost, high-capacity configuration, however, give that configuration more weight in the national average.
Cadence also enters the authors’ experience-curve argument. Their broader PNAS Nexus analysis estimates that average launch cost per kilogram fell about 21.2 per cent whenever cumulative maximum payload capacity doubled across the global record. The Economics Letters paper finds a statistically significant improvement since 2010 only for the United States and Europe, and offers India’s comparatively low launch cadence as one possible reason it has not moved down a similar curve.
That finding is an association, not proof that adding launches by itself would produce a particular saving. Cadence travels with vehicle scale, production continuity, reusability, procurement, supplier learning and the share of capacity that customers use. The authors’ framework captures some of that accumulated experience in one relationship; it does not isolate an India-specific causal effect for each extra flight.
What the ranking can and cannot say
On the authors’ definition, the supported conclusion is that India had the highest estimated unit flyaway cost per kilogram of rated LEO-equivalent capacity among the six major regions compared for 2025. The result usefully exposes the penalty that a smaller vehicle mix and limited scaling can create when national fleets are placed on one capacity-normalised measure.
It does not establish that ISRO charged customers $13,302 per kilogram, that every Indian launch was more expensive than every foreign launch, or that India’s spacecraft missions were not economical. The authors themselves distinguish cost from price: prices include market power, margins and demand conditions that their supply-side model does not estimate. Excluding vehicle research and development also prevents the ratio from serving as a complete programme-cost comparison.
A stronger test of realised launch economics would pair the model with actual manifested payload masses, contemporaneous contract prices, vehicle operating costs and uncertainty ranges, then show sensitivity to imputed inputs and development flights. Until such comparisons are made, $13,302 is a reproducible estimate of one defined capacity metric. It is not a universal price tag for Indian access to orbit.
Reporting trail
Primary sources
Economics LettersGeopolitics and space access: cost asymmetries and strategic dependencesciencedirect.com
PNAS NexusFrom Sputnik to Starship: Estimating the experience curve of space launch technologyacademic.oup.com
Mendeley DataGeopolitics and space access: cost asymmetries and strategic dependencedata.mendeley.com
The HinduDespite its reputation, India’s per-unit space launch cost highest: studythehindu.com
For an image post, download the card and copy this suggested caption.
A new dataset ranks India highest among six major launching regions in 2025. Its result divides estimated flyaway costs by vehicles’ maximum LEO capacity, leaving prices, mission budgets and actual payload masses outside the measure. Read the full report: https://www.spaceexploration.in/news/india-launch-cost-per-kilogram-study #SpaceExplorationNews #SpaceNews #SpacePolicy