Astronomy surveys
DESI releases 5.6-trillion-pixel 2D map of the sky
The public Legacy Survey release combines 263,407 telescope exposures into a catalogue of nearly four billion sources across roughly three-quarters of the sky. It records where objects appear and how bright they are; DESI’s separate spectroscopic survey supplies the redshift measurements used to place selected galaxies and quasars in three dimensions.
Add us as a preferred source on Google Add us as a preferred source on Google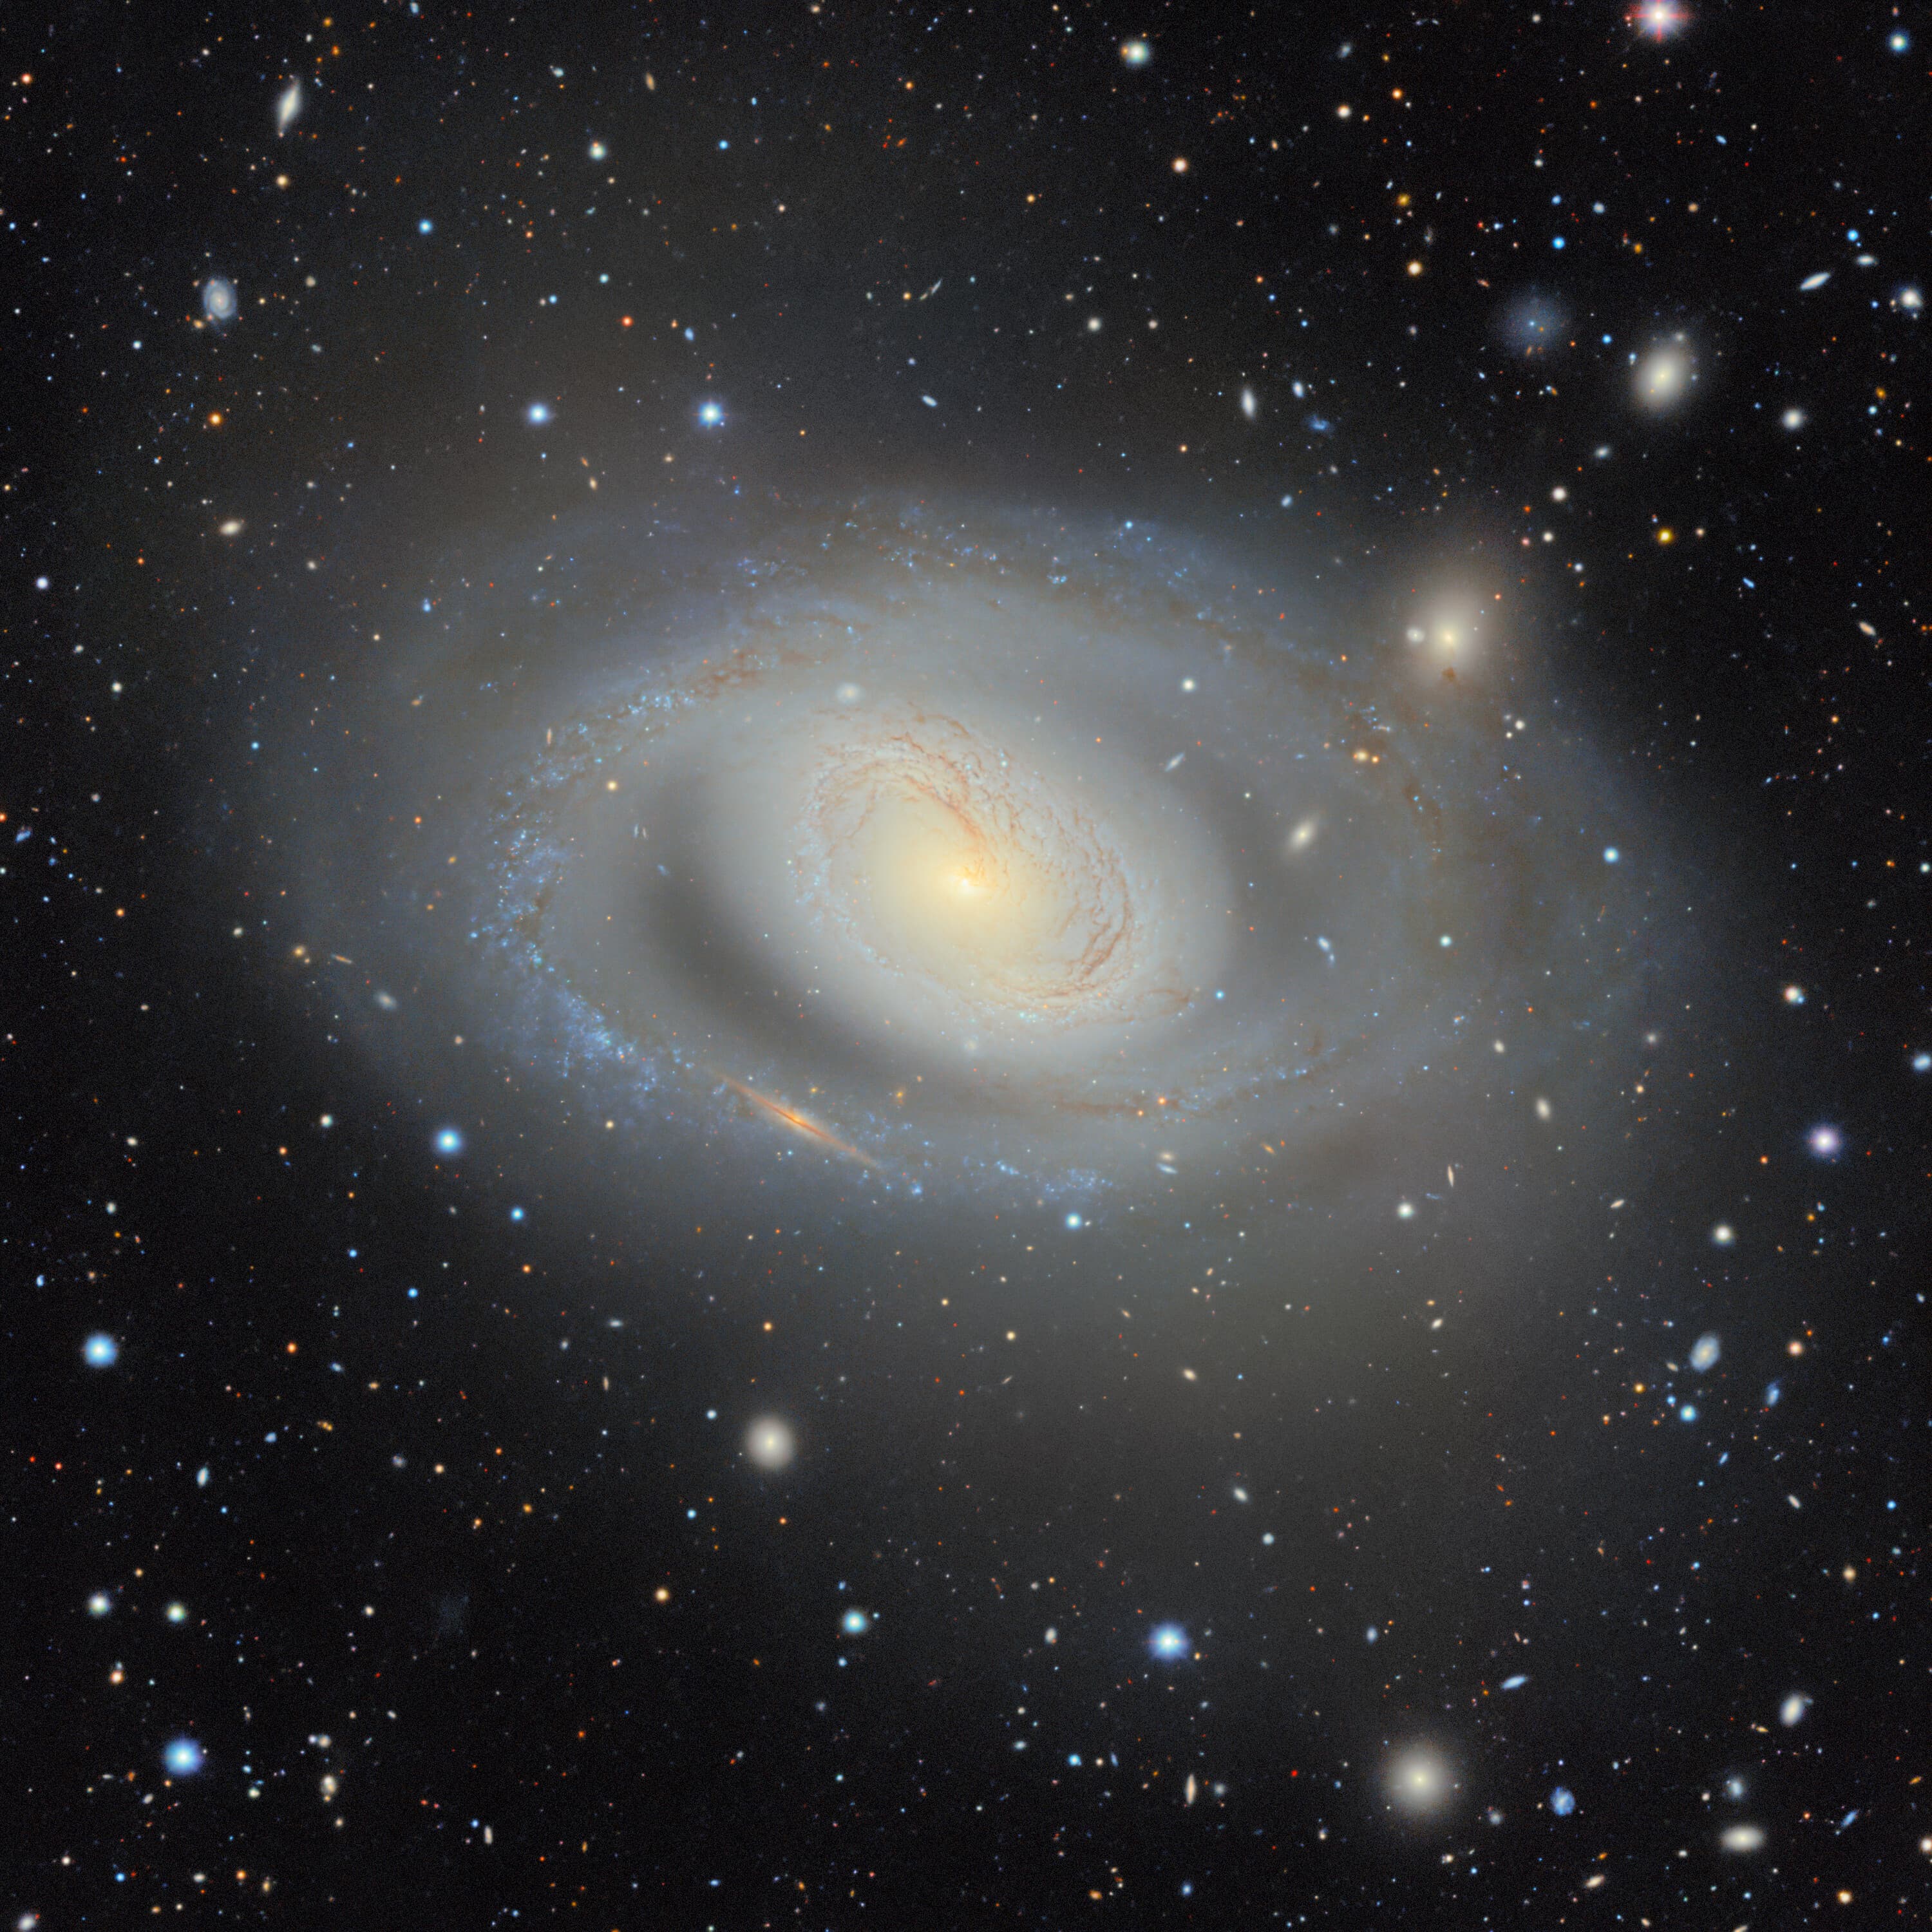
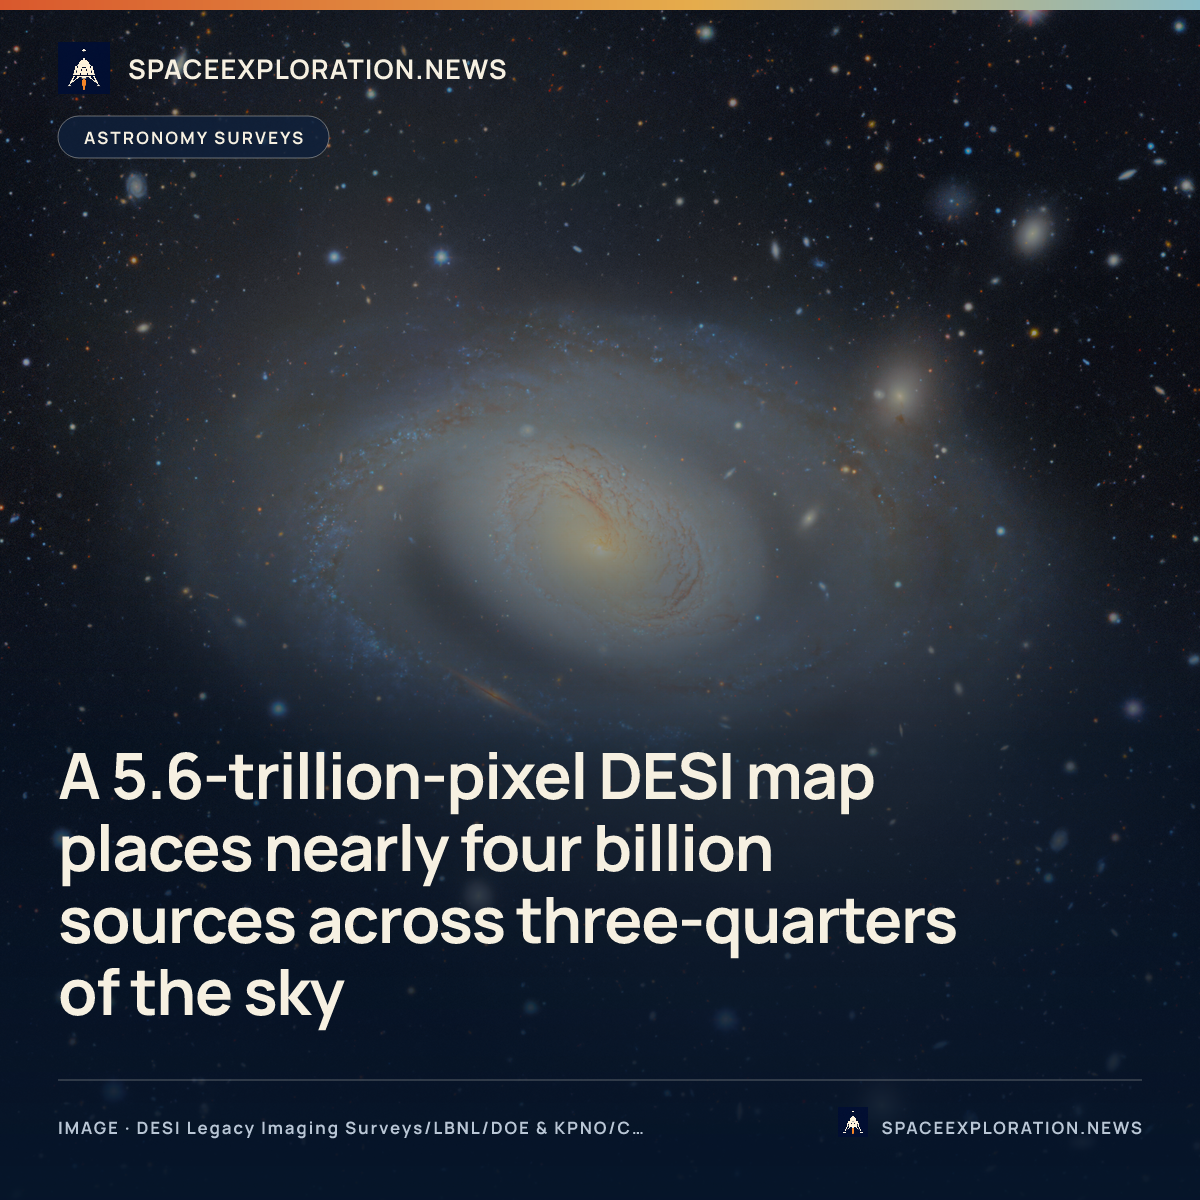
The DESI Legacy Imaging Surveys team has released a 5.6-trillion-pixel view of the sky assembled from 263,407 telescope exposures. The project says the map covers roughly 75% of the sky in visible and near-infrared light and catalogues nearly four billion celestial objects. The images, catalogue and an interactive viewer are public, so the release is both a sky atlas for browsing and a research dataset that can be queried or combined with other observations.
The “2D” label describes the measurements in the release, not a claim that the Universe itself is flat. The imaging survey records an object’s position on the sky and its brightness in several wavelength bands. Those measurements can separate broad classes of sources and provide colours and shapes, but they do not by themselves give a precise distance to every entry. A three-dimensional cosmic map needs an additional distance indicator, which is where DESI’s spectroscopic observations enter.
What is inside the public map
The release is the product of 13 years of observing and processing. Berkeley Lab says more than 160 scientists contributed to data collection and a team of 20 produced the final dataset. The 263,407 exposures came from the Dark Energy Camera Legacy Survey at Cerro Tololo in Chile, the Mayall z-band Legacy Survey and the Beijing-Arizona Sky Survey at Kitt Peak in Arizona, supplemented by NASA’s Wide-field Infrared Survey Explorer and other public data.
The latest release, Data Release 11, is not a single uniform camera survey. NSF NOIRLab’s Astro Data Lab says the dedicated DECaLS, BASS and MzLS observations were complete by Data Release 9. DR11 adds more Dark Energy Camera imaging to the southern part of the footprint, continues the i-band coverage introduced in DR10 and includes WISE measurements through year 11 of the NEOWISE reactivation mission. Its southern imaging spans observations made between August 31, 2013, and September 11, 2024.
Users can approach the release at different levels. The Legacy Survey Sky Viewer provides a pan-and-zoom colour view of the sky. The extended file collection exposes processed images and catalogues, while Astro Data Lab provides searchable tables and notebook and query services. The catalogue is therefore more than the 5.6 trillion displayed pixels: it includes measured source properties and model outputs that can be filtered and analysed without treating the whole sky as one enormous picture file.
What the map can support
NOIRLab and Berkeley Lab say astronomers can use the imaging as a reference when planning or interpreting observations, search for unusual objects such as gravitational lenses and compare data for transient events such as supernovae. Because the footprint is broad, a researcher can also cross-match a catalogue of objects from another telescope against Legacy Survey positions and photometry instead of building a new wide-field reference image for each project.
Earlier Legacy Survey releases have already been cited in more than 1,800 scientific papers, according to the two organisations. The team expects the expanded map to serve as a reference for surveys from the Vera C. Rubin Observatory and NASA’s Nancy Grace Roman Space Telescope. It is also slated for use in an astrophysics pilot within the American Science Cloud, where its images can help develop tools for analysing the much larger data volumes expected from new observatories.
The reported figure of nearly four billion objects should not be read as nearly four billion galaxies. Berkeley Lab describes the catalogue as containing primarily stars and galaxies, while the NOIRLab release also names asteroids, supernovae and gravitational lenses among the phenomena represented or discoverable in the data. An entry is a detected and modelled source in the imaging catalogue; its physical identity can require more observations, and a transient or lens candidate still needs scientific validation.
Why this is not DESI’s 3D survey
The Legacy Imaging Surveys were built first to tell DESI where suitable targets appear. In that sense, the 2D release is a deep finding chart: angular coordinates and brightness measurements identify objects that the instrument can observe. It can include estimated photometric redshifts derived from colours, but those estimates are not the same product as the redshifts measured from DESI spectra.
DESI itself is installed on the Nicholas U. Mayall 4-metre Telescope. Its robotic fibres collect light from selected galaxies, quasars and stars and feed spectrographs, which split the light by wavelength. The resulting one-dimensional spectra are fitted to classify targets and measure redshift — the stretching of spectral features associated with cosmic expansion. Astronomers use those redshifts to infer distances and place selected objects along the line of sight, turning sky positions into a three-dimensional map.
The public data products show the separation. Astro Data Lab describes DESI Data Release 1 as a spectroscopic release with more than 18 million unique targets from the first 13 months of the main survey; its primary redshift catalogue is built from co-added spectra. The Legacy Survey release instead contains the much larger imaging catalogue from which targets can be selected. One object may appear in the imaging map without ever receiving a DESI fibre or a spectroscopic distance.
DESI completed its original five-year observing plan in April 2026, but the collaboration is continuing observations into 2028 and expects to publish improved results from the first five years in 2027. Those results concern the spectroscopic programme and its study of galaxy clustering and dark energy. They should not be described as a future conversion of all four billion imaging entries into four billion precise 3D points.
The practical limits of public access
The viewer is open now, and the release pages link to downloadable files and database access. The service surfaces are not all at the same stage, however. On August 18, Astro Data Lab listed separate DR11 north and south photometry tables while marking the combined main photometry table as coming soon. Researchers planning large queries need to check the release documentation and table status rather than assume every catalogue product exposed in files or the viewer is already available through one combined database table.
Coverage also does not mean an equally deep image of every direction. The project combines several surveys, filters, observing conditions and epochs, and it concentrates on extragalactic sky away from the obscuring stars and dust of the Milky Way. The defensible description is a broad public imaging map with positions, brightnesses and source models. Precise line-of-sight distances belong to the separate DESI spectroscopic dataset, for the subset of targets that instrument observed.
Reporting trail
Primary sources
NSF NOIRLabScientists Release Biggest 2D Map of the Universenoirlab.edu
Berkeley LabScientists Release Biggest 2D Map of the Universenewscenter.lbl.gov
NSF NOIRLab Astro Data LabLS (Legacy Surveys)datalab.noirlab.edu
NSF NOIRLab Astro Data LabDESI (Dark Energy Spectroscopic Instrument)datalab.noirlab.edu
SpaceScientists create largest 2D map of the universe with 5.6 trillion pixels and nearly 4 billion cosmic objectsspace.com
For an image post, download the card and copy this suggested caption.
The public Legacy Survey release combines 263,407 telescope exposures into a catalogue of nearly four billion sources across roughly three-quarters of the sky. It records where objects appear and how bright they are; DESI’s separate spectroscopic survey supplies the redshift measurements used to place selected galaxies and quasars in three dimensions. Read the full report: https://www.spaceexploration.in/news/desi-legacy-imaging-surveys-2d-sky-map #SpaceExplorationNews #SpaceNews #SpaceScience