Science
Researchers trace near-3,000 K water vapour in V557 Mon outburst
Near-infrared spectra and ExoMol-based models track a transient molecular layer as accretion rose about 70-fold, then cooled during the 2025 decline.
Add us as a preferred source on Google Add us as a preferred source on Google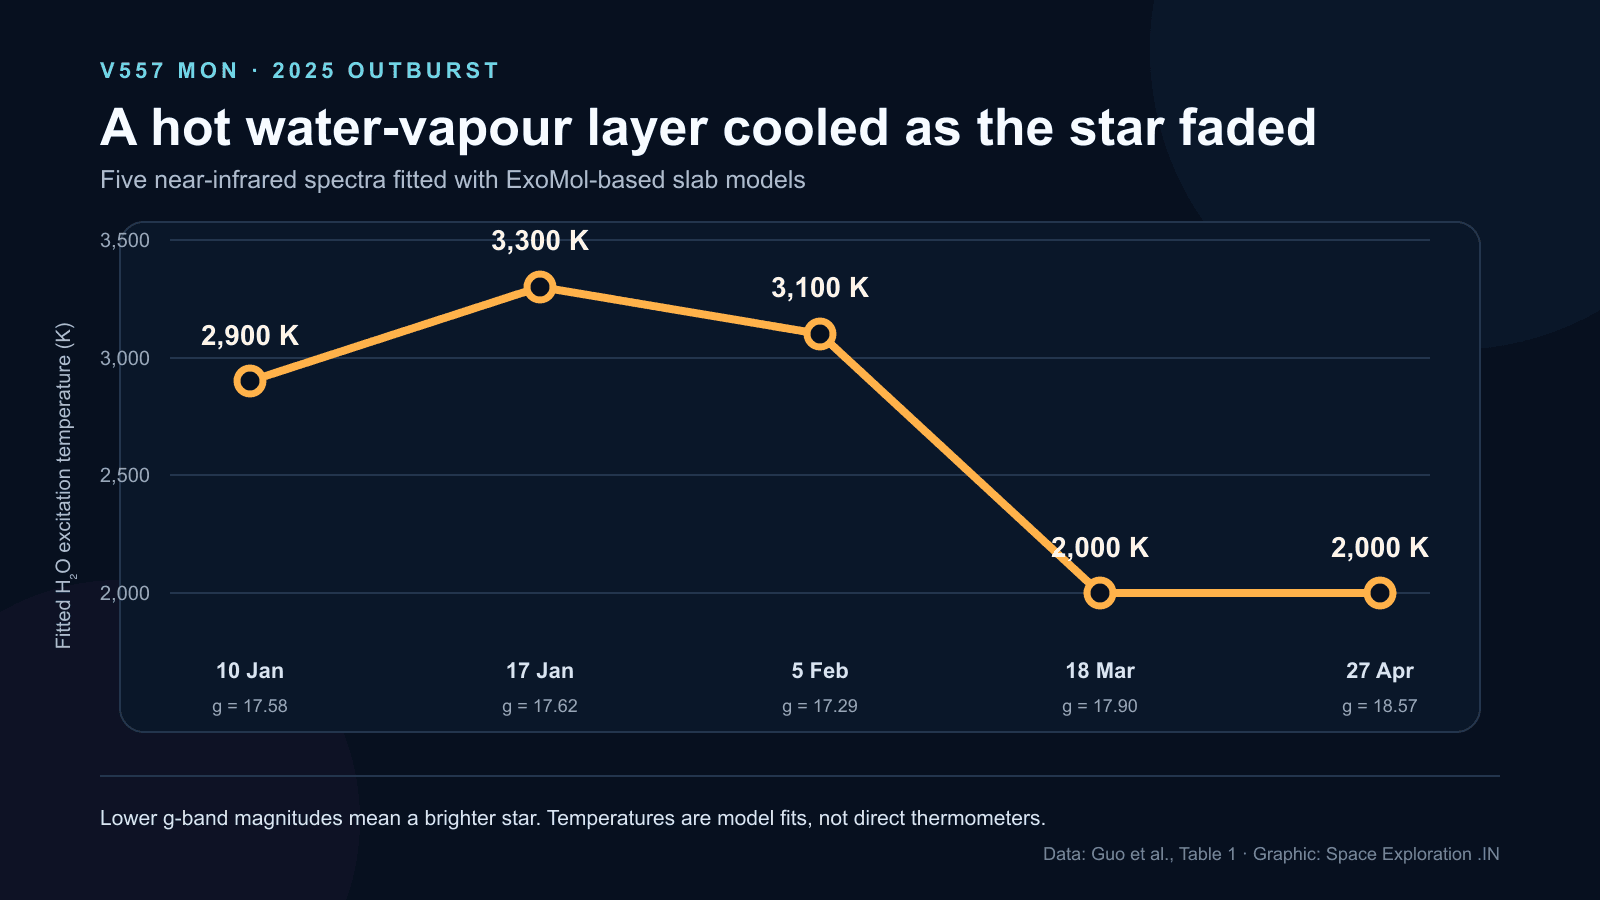
An international research team reports that V557 Mon, a young star in the Rosette Nebula, produced broad water-vapour emission while an accretion outburst heated its innermost disk. Near-infrared spectra taken during three bright epochs were best matched by water excitation temperatures of 2,900 to 3,300 kelvin; fits to two later spectra fell to about 2,000 K. The sequence turns water from a simple inventory item into a tracer of how one stellar disk responded as the eruption faded.
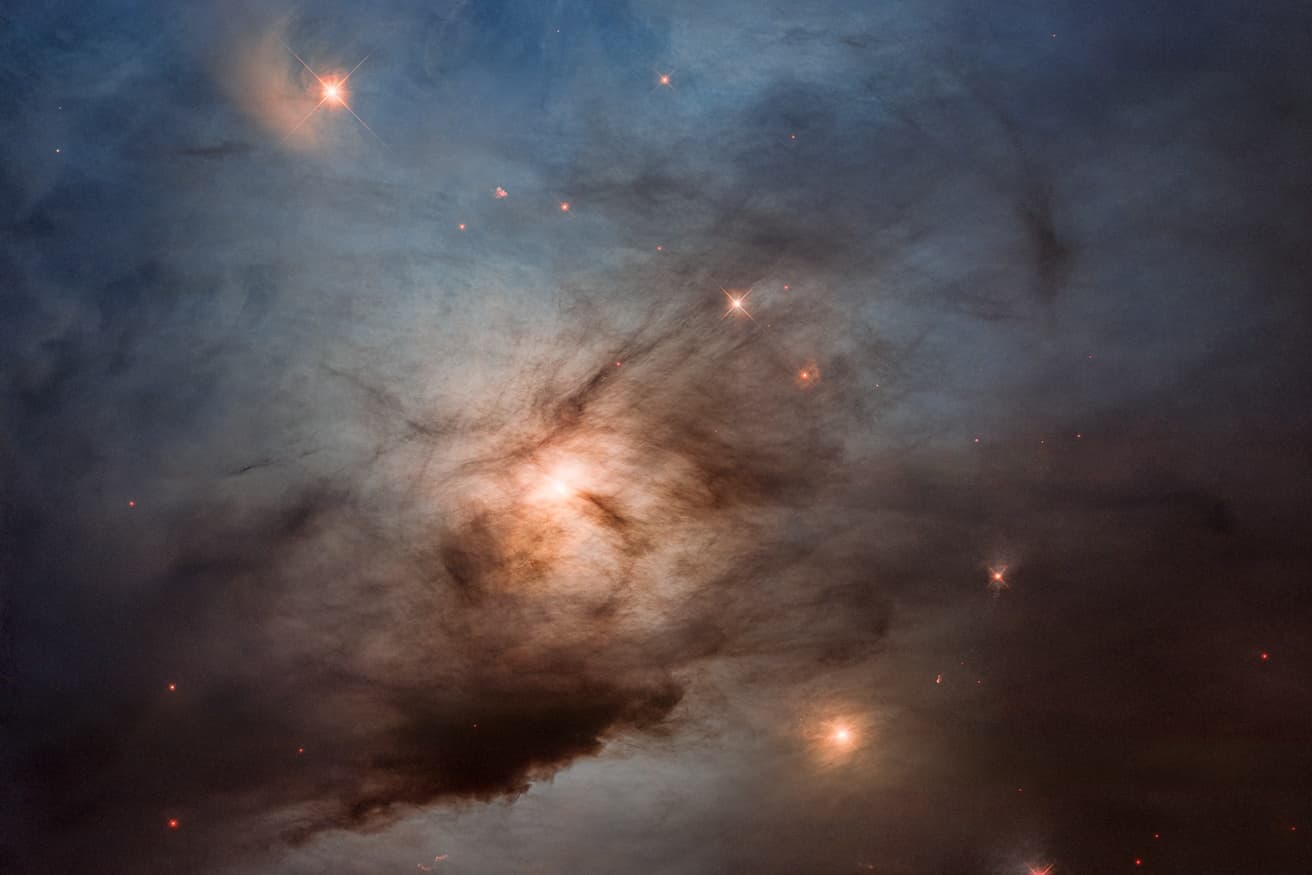
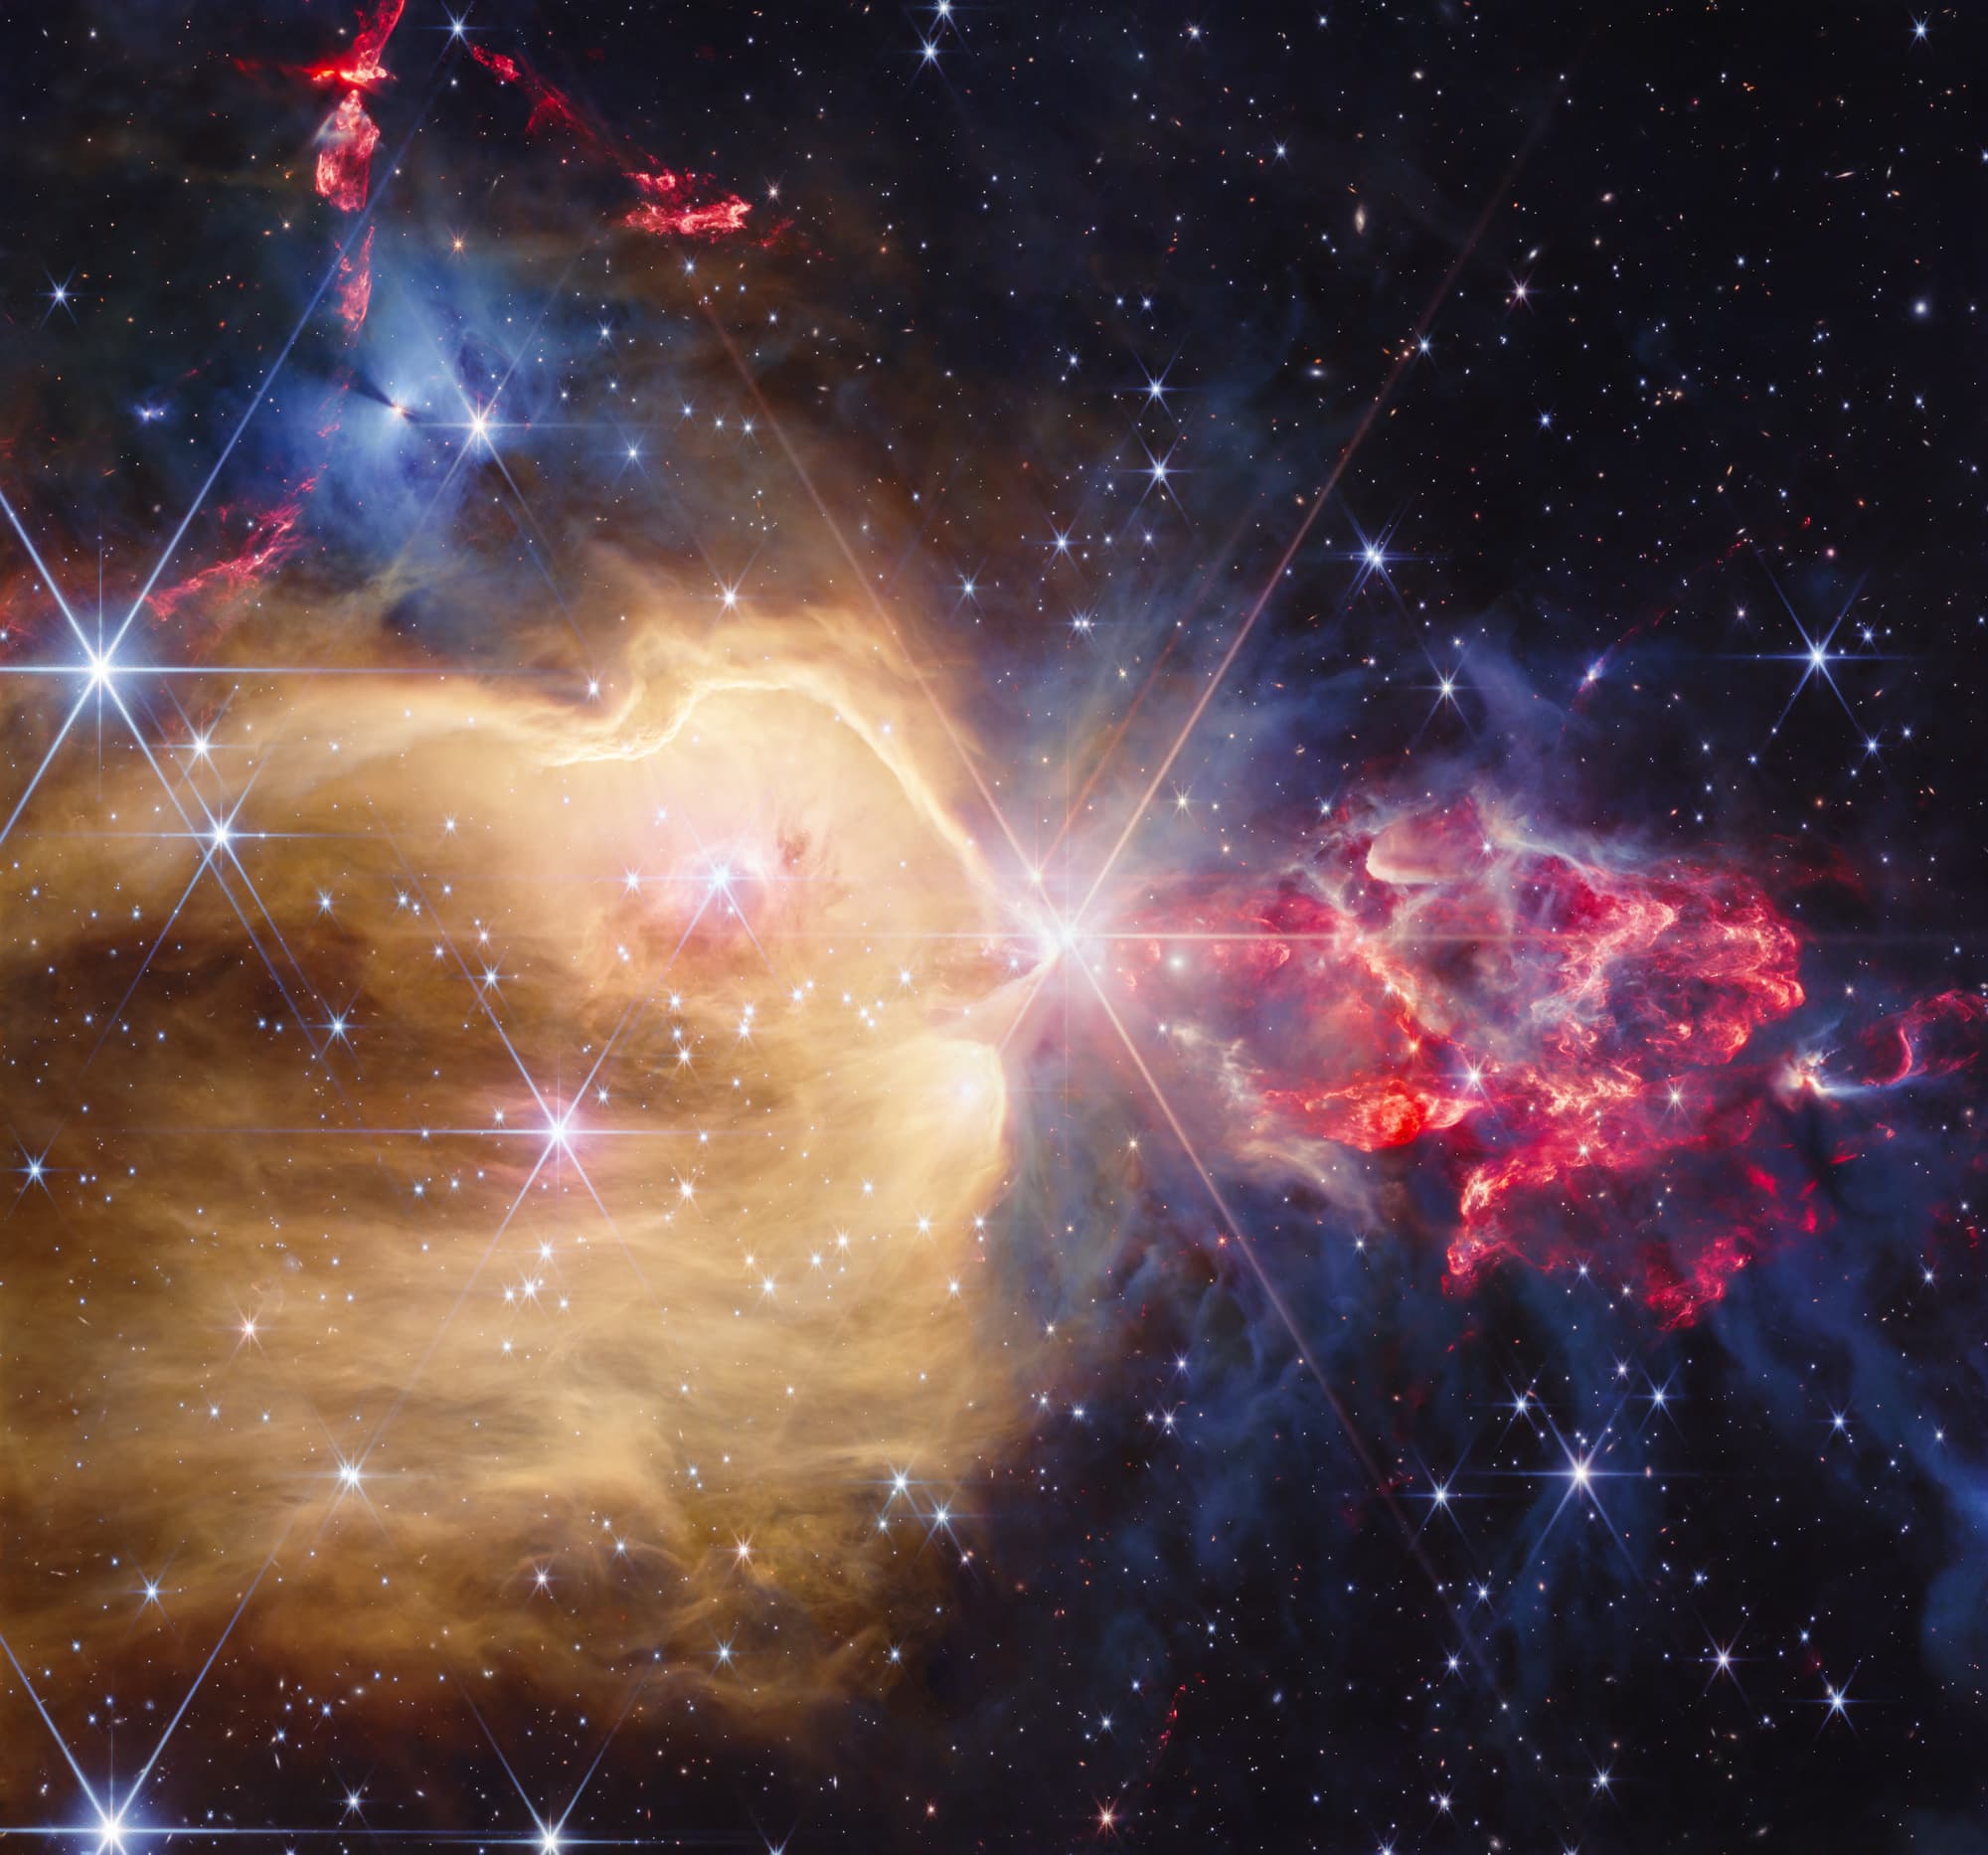
V557 Mon is a two-million-year-old, M1-type star with an estimated mass of 0.4 to 0.5 times that of the Sun. It is a Class II young stellar object surrounded by a gas-and-dust disk. The team adopted a distance of 1.44 kiloparsecs, 4,700 light-years, from the NGC 2244 cluster. The star brightened by about 4.3 magnitudes in the r band after late 2024, took roughly 60 days to reach maximum light, remained on a plateau for about 100 days and faded within a year.
A detection built from changing spectra
The study combined light curves from Gaia, the Zwicky Transient Facility, ATLAS and ground-based telescopes with optical and near-infrared spectroscopy. Follow-up used the FIRE spectrograph on Magellan Baade and instruments on the SOAR Telescope. During the outburst, the spectra contained hydrogen, helium and metal emission together with bands from carbon monoxide, titanium oxide, vanadium oxide and water. Later spectra showed none of those molecular emission bands, tying the molecular state to the temporary bright phase.
The water signature is broad rather than a single isolated line. The researchers identified emission between the standard J, H and K near-infrared observing bands and beyond 2.3 micrometres, where water overlaps with carbon-monoxide bandheads. For the water fit they concentrated on 1.7 to 2.2 micrometres and masked narrow emission lines. They also excluded more compromised regions: Brackett-continuum emission contaminates the water band near 1.5 micrometres, while carbon monoxide becomes entangled with it past 2.3 micrometres.
To test the identification, the team generated synthetic spectra with PyExoCross using molecular transition data from the ExoMol database. Its simplified slab model varied temperature from 1,700 to 3,600 K in 100 K steps and column density from 1 to 4 × 10^20 molecules per square centimetre, while fixing pressure at one bar. The observed continuum was normalised, fitted with a third-order polynomial and removed before a two-dimensional chi-squared comparison. The reported parameters are the mean of the ten model combinations with the lowest chi-squared values.
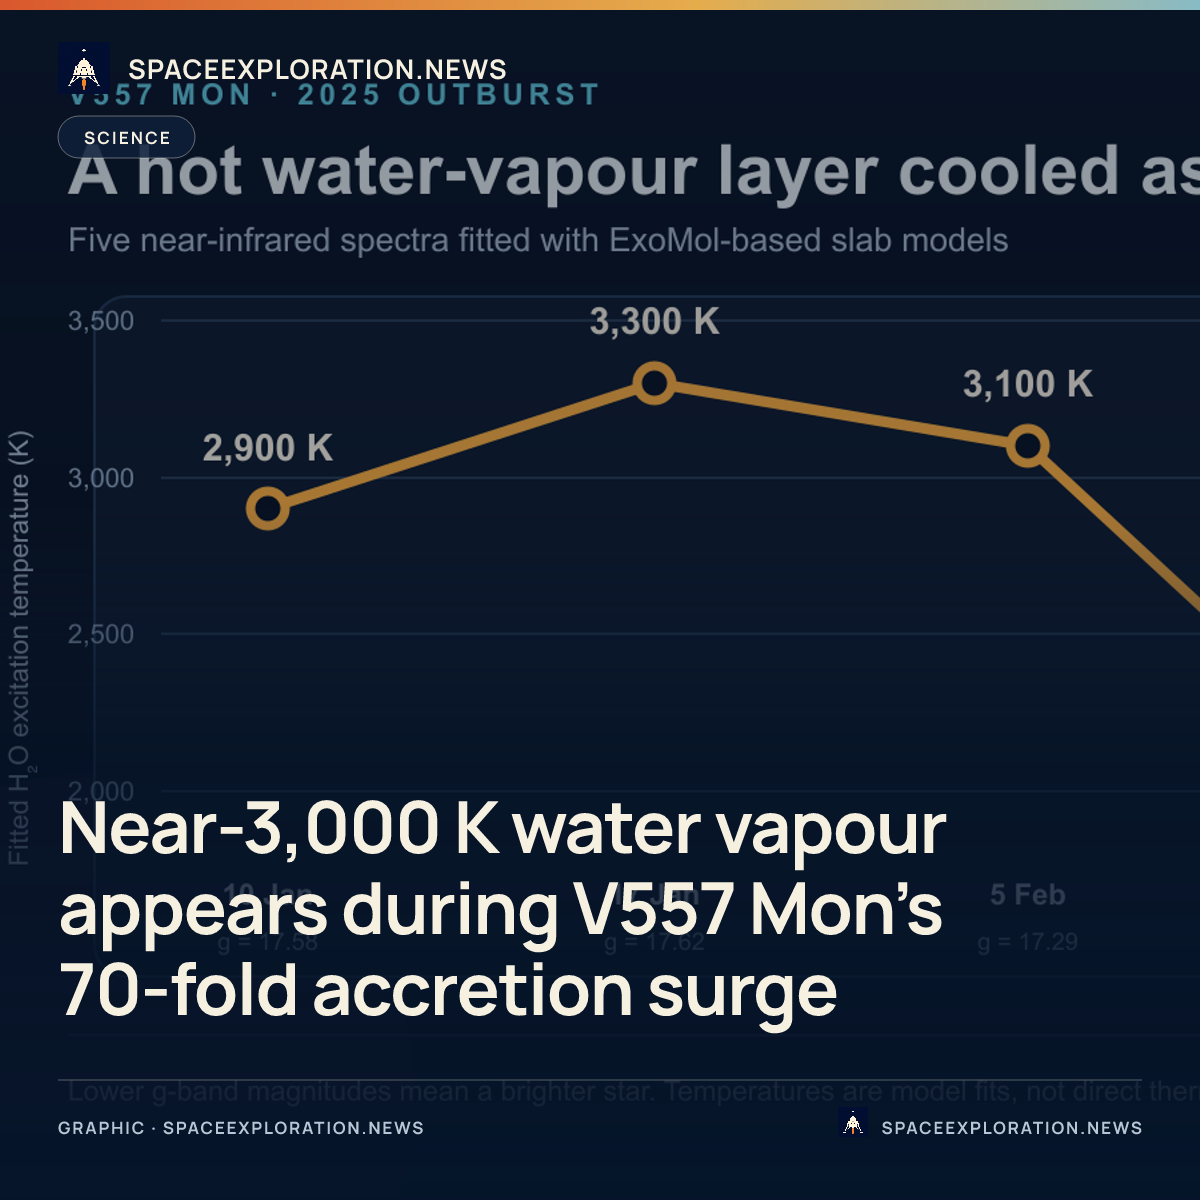
The five fitted epochs show a changing molecular layer rather than one fixed temperature. Water fits were 2,900 K on January 10, 3,300 K on January 17 and 3,100 K on February 5, 2025. Both the March 18 and April 27 spectra gave 2,000 K. Over the same series, fitted water column density decreased from roughly 3.2–3.5 × 10^20 molecules per square centimetre at the first three epochs to 2.3 and then 1.2 × 10^20, and the modelled water-band flux was lower in the last two epochs.
These temperatures are inferences from band shapes, not thermometer readings taken at a resolved point in the disk. They depend on continuum removal, a single-temperature slab and an assumed pressure; the five measurements also do not form a perfectly monotonic sequence. The paper reports a positive relation between molecular excitation and the star's g-band brightness, but the observations establish that relation across a small set of epochs and do not map the emitting gas spatially.
What the water says about accretion
Photometry provides a separate measure of the eruption's strength. The researchers estimated that V557 Mon's mass-accretion rate rose from about 0.9 × 10^-8 solar masses per year in quiescence to a peak of 6.3 × 10^-7 solar masses per year, an increase of roughly 70 times. They derived a peak accretion luminosity of about 4.6 times the Sun's luminosity. A strong near-infrared excess and hydrogen emission accompanied that rise, consistent with a dense accretion flow and a hot gas disk extending closer to the star.
The study translates those observables into approximate inner-disk scales. Under representative magnetic-field and stellar assumptions, its magnetospheric model moves the disk's truncation radius from about 0.06–0.07 astronomical units in quiescence to roughly 0.02 AU during the burst. A separate irradiation estimate places gas at 3,000 to 2,000 K at characteristic radii of about 0.015 to 0.033 AU. Both calculations are order-of-magnitude models, not direct images of a moving disk edge.
The authors compare V557 Mon with V2492 Cyg, a more deeply embedded Class I young stellar object whose spectrum has shown similar water and carbon-monoxide emission. They describe V557 Mon's outburst as a short-lived rejuvenation of a more evolved Class II disk: increased accretion recreated some conditions associated with a younger, more active system. That is a physical analogy, not a reversal of the star's age or evolutionary history.
As V557 Mon dimmed, the fitted molecular column densities weakened and the emission bands eventually disappeared. The paper says the hot inner disk cooled over roughly 150 days and offers two possibilities for the vanishing bands: fewer molecules in the emitting layer, or greater self-shielding as gas moved into cooler layers. The spectra therefore track a chemical and thermal response, but they do not determine whether the burst created new water, heated an existing reservoir or changed which part of the disk was visible. Nor does hot water vapour imply liquid water or a habitable environment.
Limits and a two-date release record
The largest observational gap falls at the start of the event. Spectroscopy did not cover the first 100 days, including the rising phase, so the team could not watch the hot molecular layer switch on or use its timing to identify the eruption's trigger. The later spectra support short-lived heating and contraction of the magnetospheric boundary, but several instability mechanisms can produce young-star outbursts and this campaign does not choose among them.
The Universidad de Valparaíso announcement also carries a date discrepancy. The article's printed date is August 13, 2026 (13 agosto), while the public WordPress record for the same post lists publication at 10:11:54 local time on August 14, or 14:11:54 UTC. Space Exploration .IN uses the August 14 metadata timestamp when assessing the release window and retains both dates here rather than silently replacing the visible dateline.
The university says the work was accepted by Astronomy & Astrophysics. The arXiv record, submitted August 4 and revised August 5, 2026, did not list a journal DOI when checked on August 20. The conclusion available now is narrow: repeated spectra and molecular models trace a hot water-bearing inner-disk layer during the outburst and its subsequent cooling. Spectra obtained during the next event's rise will be needed to show when that layer forms and whether its timing distinguishes the accretion trigger.
Reporting trail
Primary sources
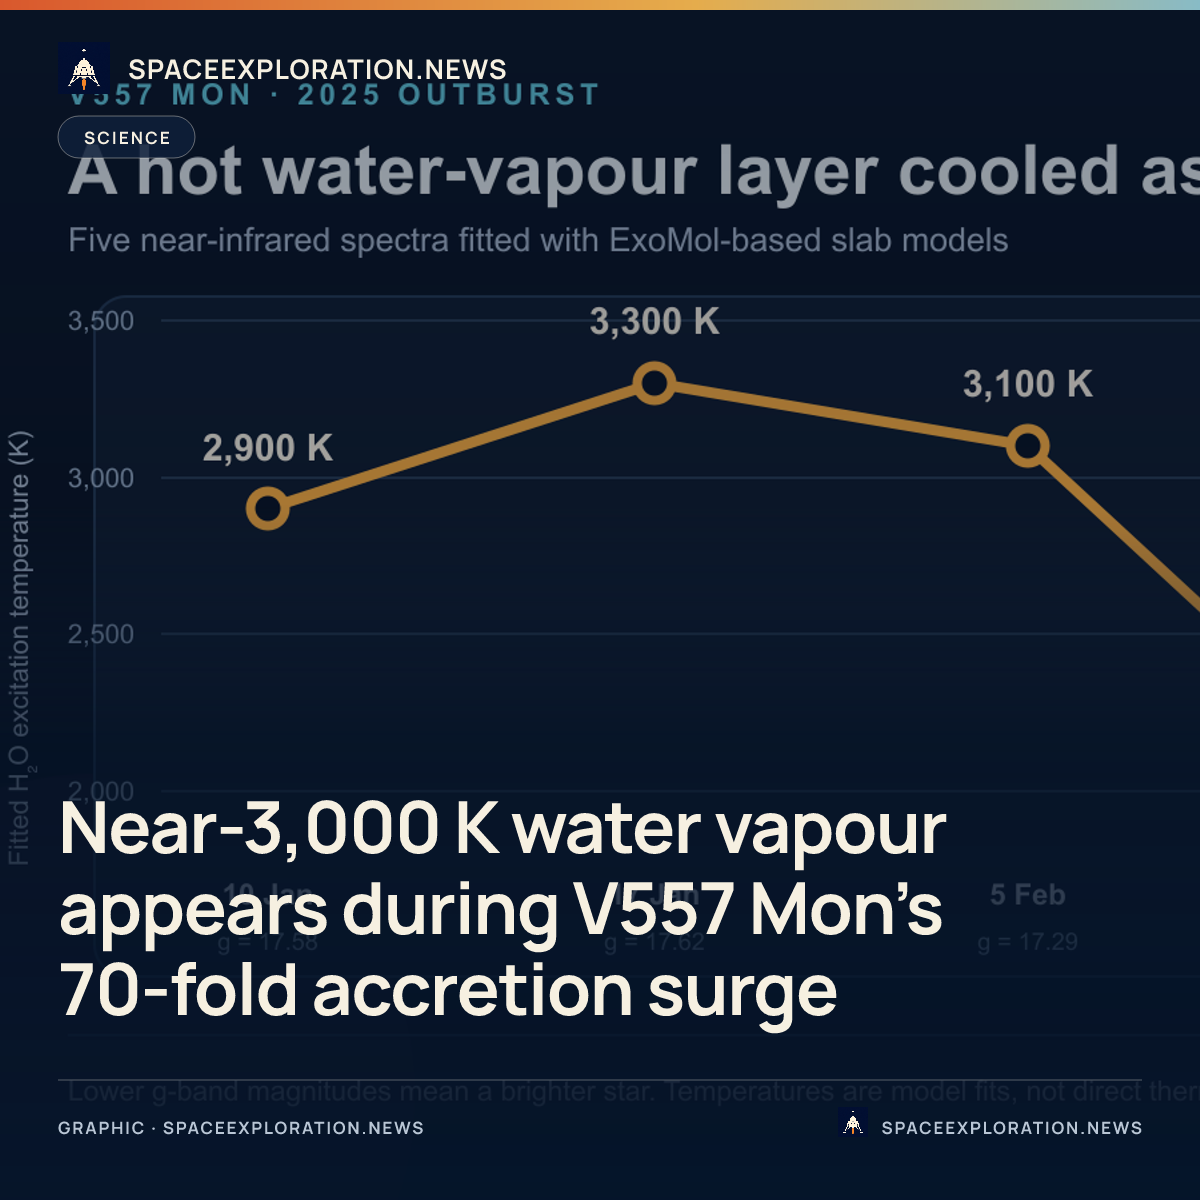
For an image post, download the card and copy this suggested caption.
Near-infrared spectra and ExoMol-based models track a transient molecular layer as accretion rose about 70-fold, then cooled during the 2025 decline. Read the full report: https://www.spaceexploration.in/news/v557-mon-hot-water-vapour-outburst #SpaceExplorationNews #SpaceNews #SpaceScience