Earth science
VIIRS images trace Lala from hurricane to tropical storm near Hawai‘i
NASA published the views on August 18, but Suomi NPP and NOAA-20 observed the storm on August 15 and 16; ground reports document the rain, wind and transport damage.
Add us as a preferred source on Google Add us as a preferred source on Google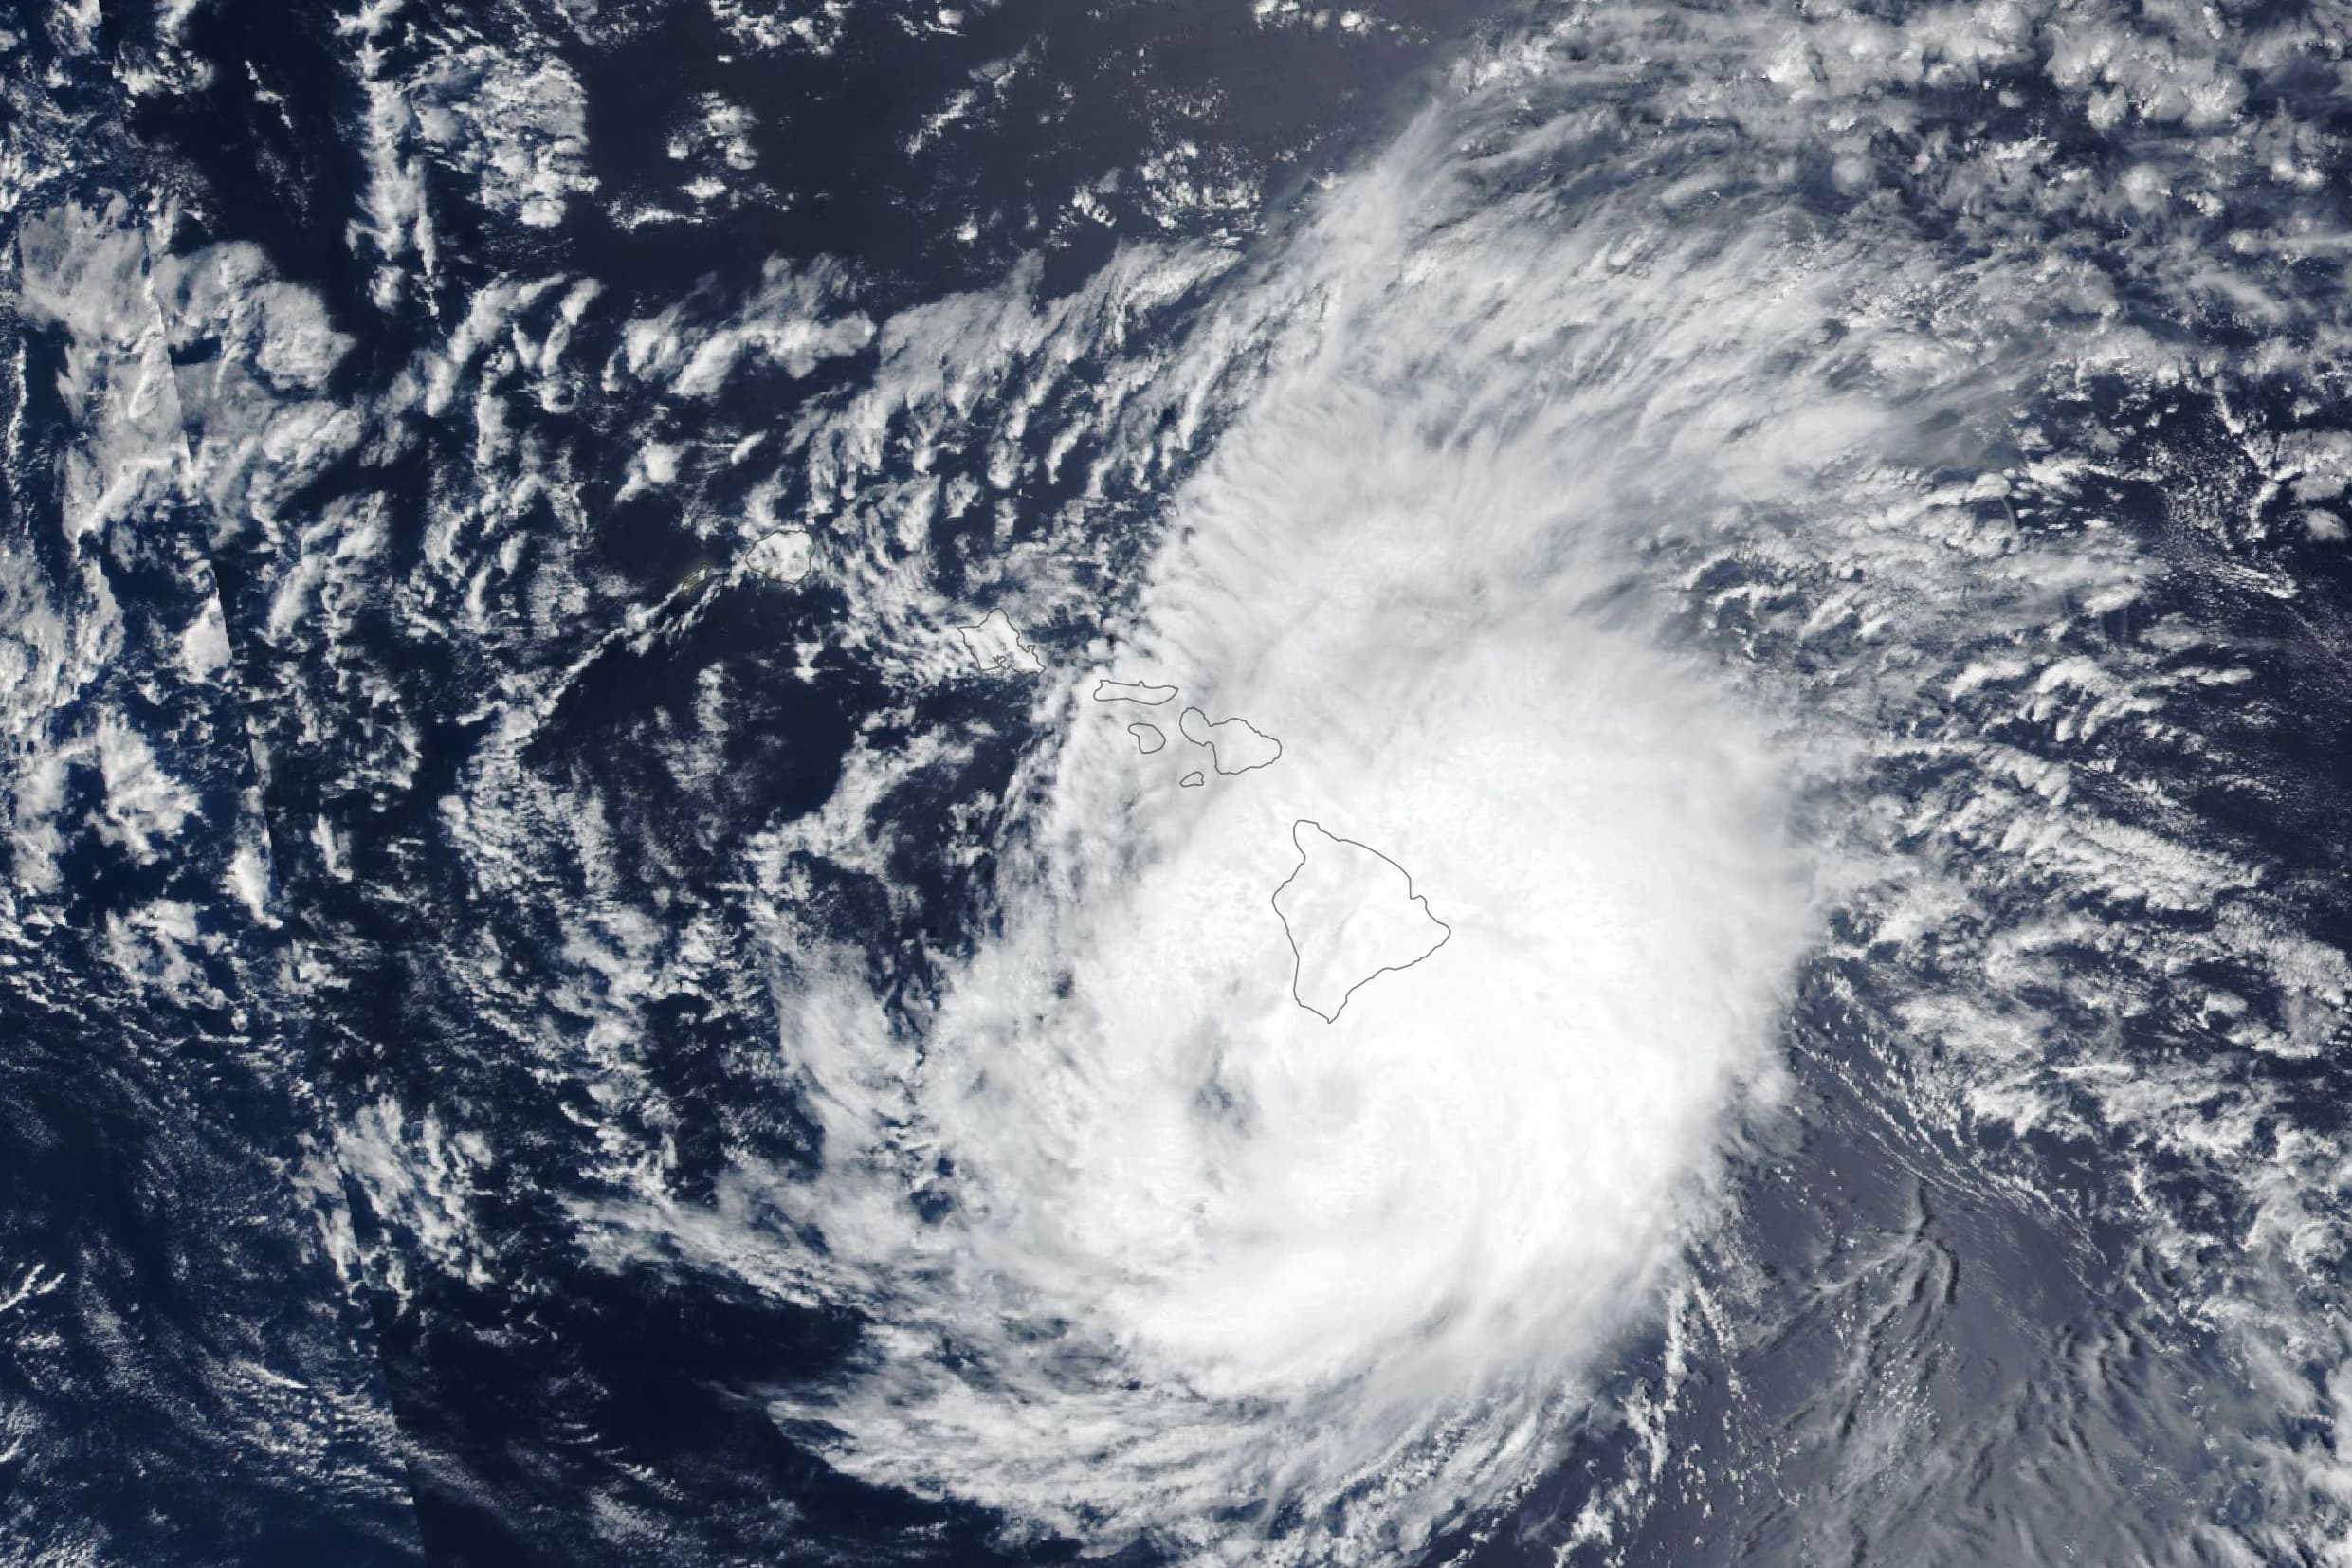
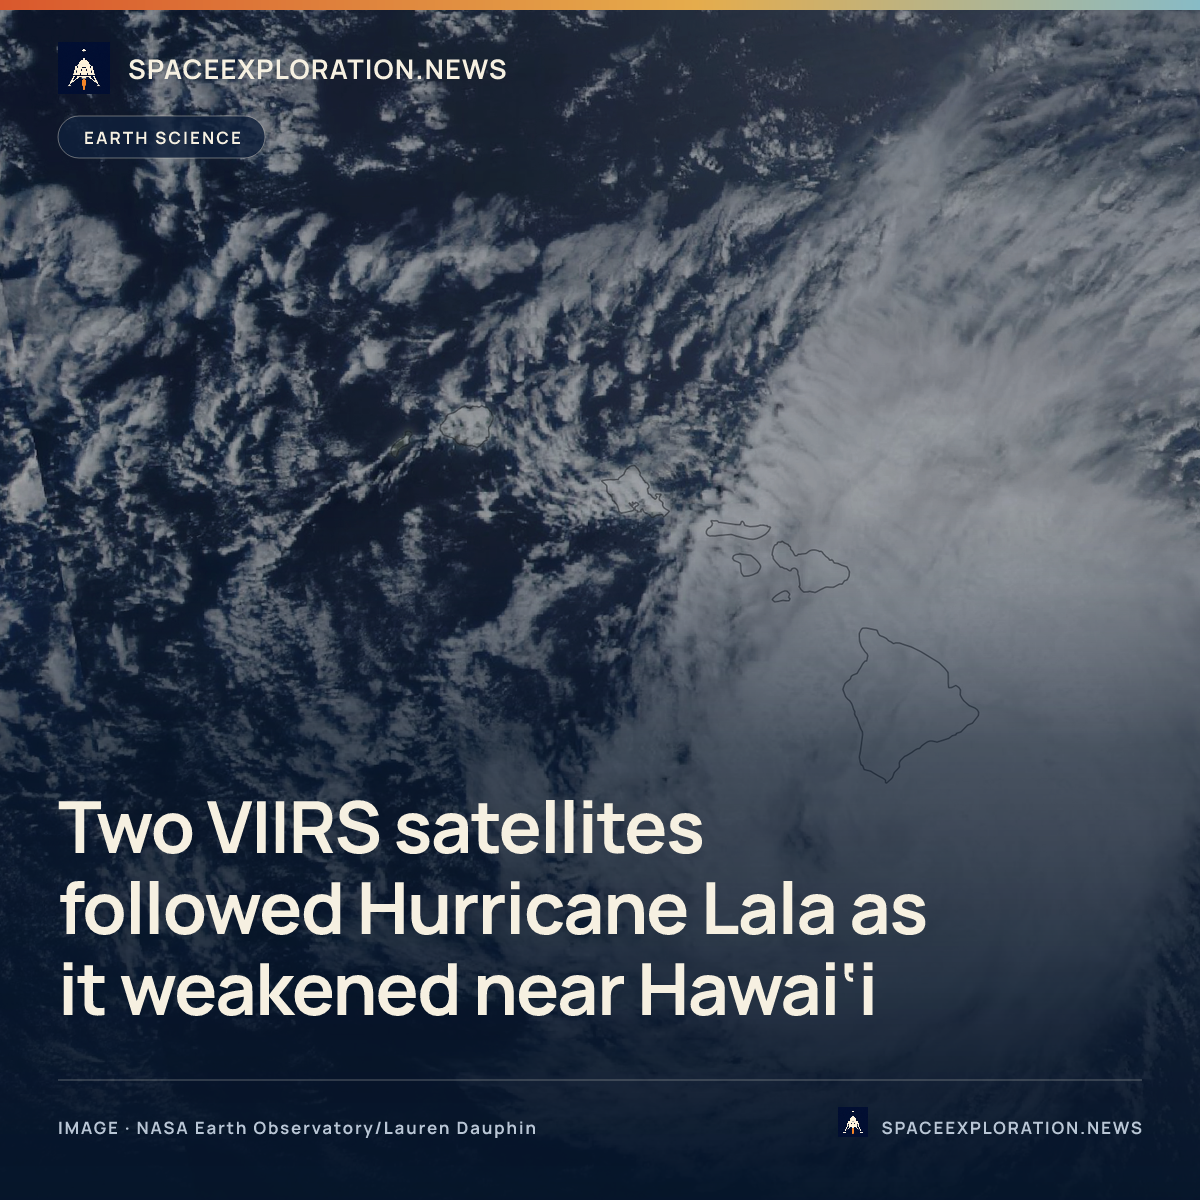
NASA Earth Observatory published two VIIRS views of Lala on August 18, three days after the first satellite pass caught the storm just south of the Island of Hawai‘i. The Suomi National Polar-orbiting Partnership satellite (Suomi NPP) observed Lala as a category 1 hurricane on August 15; NOAA-20 recorded it about 24 hours later, after it had weakened to a tropical storm and moved northwest toward Kaua‘i. The paired images supply a dated overhead record of the storm’s movement. Official hurricane advisories, rain and wind observations, and transport reports establish what happened on the ground.
The date beneath NASA’s Image of the Day is therefore not the date both views were made. The first acquisition occurred at about 1:45 p.m. Hawaii Standard Time (23:45 UTC) on August 15. NASA says NOAA-20 collected the second in early afternoon on August 16, about one day later. Keeping those times separate from the August 18 publication matters because the cloud fields belong to different stages of Lala’s passage; the page is a retrospective package, not an August 18 observation.
Two satellites captured two phases
At 11 a.m. HST on August 15, roughly three hours before the Suomi NPP pass, the National Hurricane Center placed Lala 65 miles (105 kilometres) south-southeast of South Point. Maximum sustained winds were 75 mph (120 km/h), just above the hurricane threshold, and the centre was moving northwest at 8 mph (13 km/h). NASA’s later satellite view shows the eye just south of Hawai‘i Island. The advisory and image are close in time but not simultaneous, so the wind estimate should not be treated as a reading taken from the VIIRS pixels.
By 11 a.m. HST on August 16, NHC had downgraded Lala to a tropical storm with 65 mph (100 km/h) sustained winds. Its centre was 275 miles (440 kilometres) west-northwest of Kailua-Kona and 140 miles (220 kilometres) west of Honolulu, while outer bands were bringing heavy rain and gusty winds to Maui County, O‘ahu and Kaua‘i County. NASA says the NOAA-20 view followed in early afternoon, with the storm southwest of Kaua‘i. Together, the positions explain the shift between the two views without implying that either image is continuous tracking.
The views are snapshots, not damage maps
VIIRS stands for Visible Infrared Imaging Radiometer Suite. The instruments on Suomi NPP and NOAA-20 collected the two views about 24 hours apart, and NASA Earth Observatory turned data from those passes into the published images. The agency credits image creator Lauren Dauphin and data systems including NASA EOSDIS LANCE, GIBS/Worldview and the Joint Polar Satellite System. The images reveal the storm’s organised cloud field, eye and changing position against the islands. They do not directly report a rain-gauge total, a surface wind gust or a damaged road.
The division of evidence is important in a storm report. NASA’s imagery documents when and where the cloud structure was visible from orbit. NHC advisories supply position, motion, maximum sustained winds and hazard descriptions near the acquisition times. The Weather Prediction Center’s station list supplies observed rainfall and gusts, while the Hawai‘i Department of Transportation (HDOT) records road, airport and harbour conditions. Reading the sources together connects the satellite record to impact without claiming that a cloud image alone measured the damage.
Ground records show the impact
WPC’s final storm summary, issued August 17, listed a preliminary 43.55 inches (110.6 centimetres) of rain at Laupāhoehoe. Several other Hawai‘i Island stations exceeded 35 inches, and Hilo International Airport recorded 14.21 inches. The same summary listed a preliminary peak gust of 140 mph at the Mauna Kea summit and 91 mph at a station identified as Hawai‘i 202602. Those readings are measurements from ground stations, not values derived from VIIRS. WPC said wind and rainfall associated with Lala had ended by 10 a.m. HST on August 17.
The transport account gives the rainfall and wind a physical consequence. On August 16, HDOT reported highways affected by downed trees, debris, flooding and power outages at traffic signals. A section of Māmalahoa Highway, Route 11, had washed out near Pāhala, and Nā‘ālehu remained isolated by additional blockages and utility lines across the road. Pali Highway on O‘ahu was closed by fallen trees and landslides; Hanalei Bridge on Kaua‘i was closed by flooding in the river. The agency also reported closures or debris on roads in Maui and other parts of O‘ahu.
Some transport systems were already reopening while road recovery continued. Hilo and Kona airports reopened on the morning of August 16 after runway and terminal inspections, although the department warned that cancellations and delays remained. All commercial harbours had reopened by 4 p.m. HST. Those timestamps overlap the second satellite pass, but they describe operational decisions and inspections, not conditions visible in the VIIRS scene. The image shows the storm beside the island chain; the HDOT report identifies which routes and facilities were disrupted.
Why the August 18 date matters
NASA published its image pair after the main islands’ wind and rainfall had ended. That timing lets the two satellite acquisitions be read as a sequence: hurricane south of Hawai‘i Island on August 15, then tropical storm west of the main islands on August 16. The August 18 label describes when NASA assembled and released that sequence. The dated VIIRS passes preserve the storm’s movement; the NHC, WPC and HDOT records preserve the intensity, measured extremes and damage that an overhead view cannot supply.
Reporting trail
Primary sources
NASA Earth ObservatoryLala Batters Hawaiiscience.nasa.gov
National Hurricane CenterHurricane Lala Advisory Number 14nhc.noaa.gov
National Hurricane CenterTropical Storm Lala Advisory Number 18nhc.noaa.gov
Weather Prediction CenterStorm Summary Number 4 for Heavy Rainfall and Wind Associated with Lalawpc.ncep.noaa.gov
Hawai‘i Department of TransportationTropical Storm Lala Updateshidot.hawaii.gov
For an image post, download the card and copy this suggested caption.
NASA published the views on August 18, but Suomi NPP and NOAA-20 observed the storm on August 15 and 16; ground reports document the rain, wind and transport damage. Read the full report: https://www.spaceexploration.in/news/hurricane-lala-viirs-hawaii #SpaceExplorationNews #SpaceNews #SpaceScience