Earth science
NASA-backed 2022–2025 study attributes most Addis Ababa black carbon to fossil fuels
Ten monitors tracked fine particles across Ethiopia’s capital, while black-carbon instruments at two sites resolved traffic, wet-season and holiday pollution patterns.
Add us as a preferred source on Google Add us as a preferred source on Google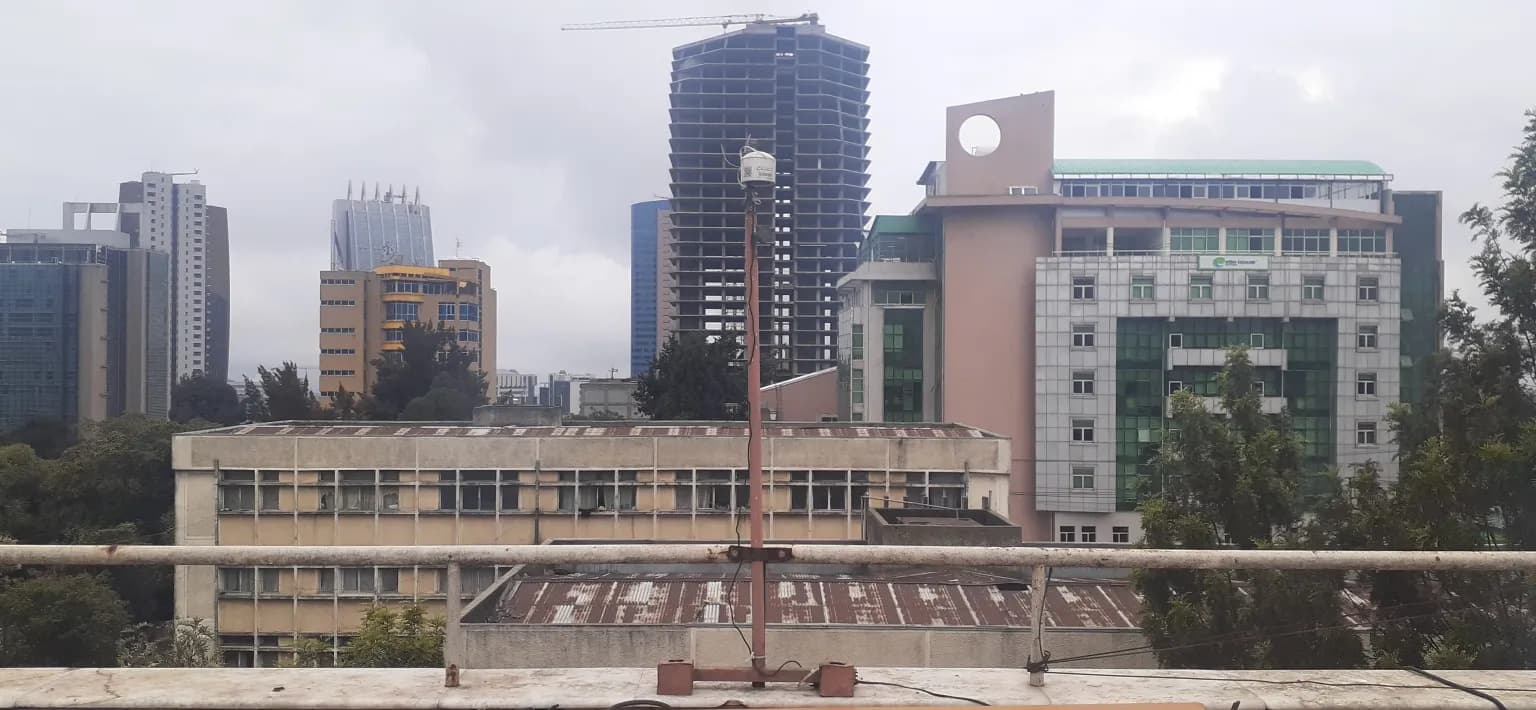
NASA’s August 17 analysis of air pollution over Addis Ababa draws on measurements made from April 1, 2022, through March 31, 2025—not readings taken in 2026. The peer-reviewed study’s source-apportionment model assigned 94% of measured black carbon to fossil-fuel combustion and about 6% to biomass burning. Across ten sites measuring particles 2.5 micrometres or smaller, known as PM2.5, the average concentration was 30 micrograms per cubic metre, and daily averages exceeded the World Health Organization’s 24-hour guideline on 98.7% of study days. The record gives Ethiopia’s capital a dated baseline against which later measurements can be compared.
The ten-site figure applies to PM2.5. Each location carried a PurpleAir sensor, while two contrasting U.S. Embassy sites—Central and Jacros—also hosted research-grade instruments that measured black carbon continuously. Reference-grade beta attenuation monitors at those two sites were used to calibrate the lower-cost PM2.5 sensors. Consequently, the study maps citywide contrasts in fine particles across ten sites but reports continuous black-carbon concentrations only at Central and Jacros.
What the ten PM2.5 sites recorded
The monitors covered commercial, residential, educational, industrial and green-space settings. Black Lion Hospital had the highest mean PM2.5 concentration at 37.27 micrograms per cubic metre, followed by Skylight Hotel at 36.12 and the Reppie waste site at 36.04. Addis Ababa Science and Technology University, on the city’s edge, had the lowest mean at 21.60. Central and western sites were generally more polluted than peripheral locations, and that broad spatial ordering persisted across seasons.
Pollution also followed a daily and seasonal clock. PM2.5 rose during the morning rush while the atmospheric boundary layer was low, fell as winds and vertical mixing strengthened around midday, and climbed again near 7 p.m. The evening peak became strongest during Kiremt, the June-to-September wet season. Excluding the Meskel holiday, the monthly mean reached 40.02 micrograms per cubic metre in September versus 24.52 in February. The authors calculated that Kiremt’s average ventilation coefficient was 51% lower than during the rest of the year, so emissions dispersed less efficiently.
Black carbon shows a combustion schedule
The two black-carbon instruments exposed a sharp local contrast. Jacros averaged 7.67 micrograms per cubic metre and recorded a maximum hourly concentration of 113.50; Central averaged 3.73 and peaked at 56.63. Black carbon made up an average 24.2% of PM2.5 at Jacros and 17.4% at Central. At both sites, that fraction peaked between 6 and 7 a.m., when fresh combustion emissions had a larger influence on the particle mix.
The researchers derived that source split with a two-source Aethalometer Model. It is not a finding that fossil fuels supplied 94% of all PM2.5, or of every pollutant emitted in Addis Ababa. It is a modelled apportionment of the black-carbon component based on assumed optical signatures. The fossil-fuel component and total black carbon were substantially lower on Sundays, while the biomass-burning component changed little across the week, a pattern consistent with reduced workday traffic.
Hourly measurements also separated recurring holiday episodes from the normal daily cycle. During Meskel in 2024, black carbon surpassed 100 micrograms per cubic metre at Jacros and 50 at Central, with the model assigning roughly half of the signal to biomass burning. During Hidar Sitaten in 2022 and 2024, hourly peaks were about 70 at Jacros and 30 at Central; the 2023 event did not differ significantly from typical November levels. A filter sample taken once per day could blur such short-lived changes, while continuous instruments preserve their timing and source signature.
A trajectory analysis added a more tentative result. In the October-to-January Bega dry season, air parcels associated with higher concentrations traced eastward towards the Gulf of Aden. The authors said shipping emissions could contribute because heavy fuel oil can resemble the model’s biomass-burning optical signature. They explicitly treated that link as indicative, not conclusive: the trajectory method identifies source regions associated with high readings, not individual emitters.
Why NASA needs the ground record
The Multi-Angle Imager for Aerosols, or MAIA, is planned as both a surface network and a space observatory. NASA says the satellite camera, built at the Jet Propulsion Laboratory and due to launch with the Italian Space Agency no earlier than late 2027, will view target areas from several angles to distinguish particle properties. The Addis Ababa record gives that future orbital analysis ground truth: local measurements of near-surface particle levels and composition that satellite observations and atmospheric models can use to produce spatially continuous maps.
The ground network is useful before the satellite flies. Multiple sites show that a single citywide average can hide large neighbourhood differences; hourly data reveal traffic peaks and festival plumes; meteorological data help separate changing emissions from changing dispersion. The paper says the surface measurements are publicly available through NASA Earthdata, allowing the 2022–2025 interval to be revisited when later observations or policy changes are assessed.
Limits that matter
Ten PM2.5 sensors and two black-carbon monitors do not provide complete coverage of a metropolitan area of nearly six million people. The researchers also applied one calibration equation, trained at Central and Jacros, to all ten PurpleAir sensors. That reduced the hourly root-mean-square error from 15.21 to 8.21 micrograms per cubic metre in testing, but residual differences in humidity and particle properties can still affect individual sites. The paper therefore places more weight on persistent spatial and seasonal patterns than on small site-to-site or hour-to-hour differences.
Source apportionment has a separate limit: diverse fuels can produce overlapping optical signals, so some mixing between the fossil-fuel and biomass categories is expected. The most defensible reading of the record is therefore narrower than a citywide emissions inventory. From April 2022 through March 2025, the monitored sites repeatedly showed high PM2.5, strong morning and evening combustion peaks, and a black-carbon signal dominated by the model’s fossil-fuel category. MAIA’s post-launch observations can test how well that ground pattern extends across the wider region.
Reporting trail
Primary sources

For an image post, download the card and copy this suggested caption.
Ten monitors tracked fine particles across Ethiopia’s capital, while black-carbon instruments at two sites resolved traffic, wet-season and holiday pollution patterns. Read the full report: https://www.spaceexploration.in/news/addis-ababa-black-carbon-2022-2025 #SpaceExplorationNews #SpaceNews #SpaceScience