Solar science
Aditya-L1 maps an iron X-ray echo across 47 major solar flares
The 6.40 keV signal tracked flare X-rays and weakened toward the solar limb, giving SoLEXS a possible way to constrain coronal source geometry—with important limits.
Add us as a preferred source on Google Add us as a preferred source on Google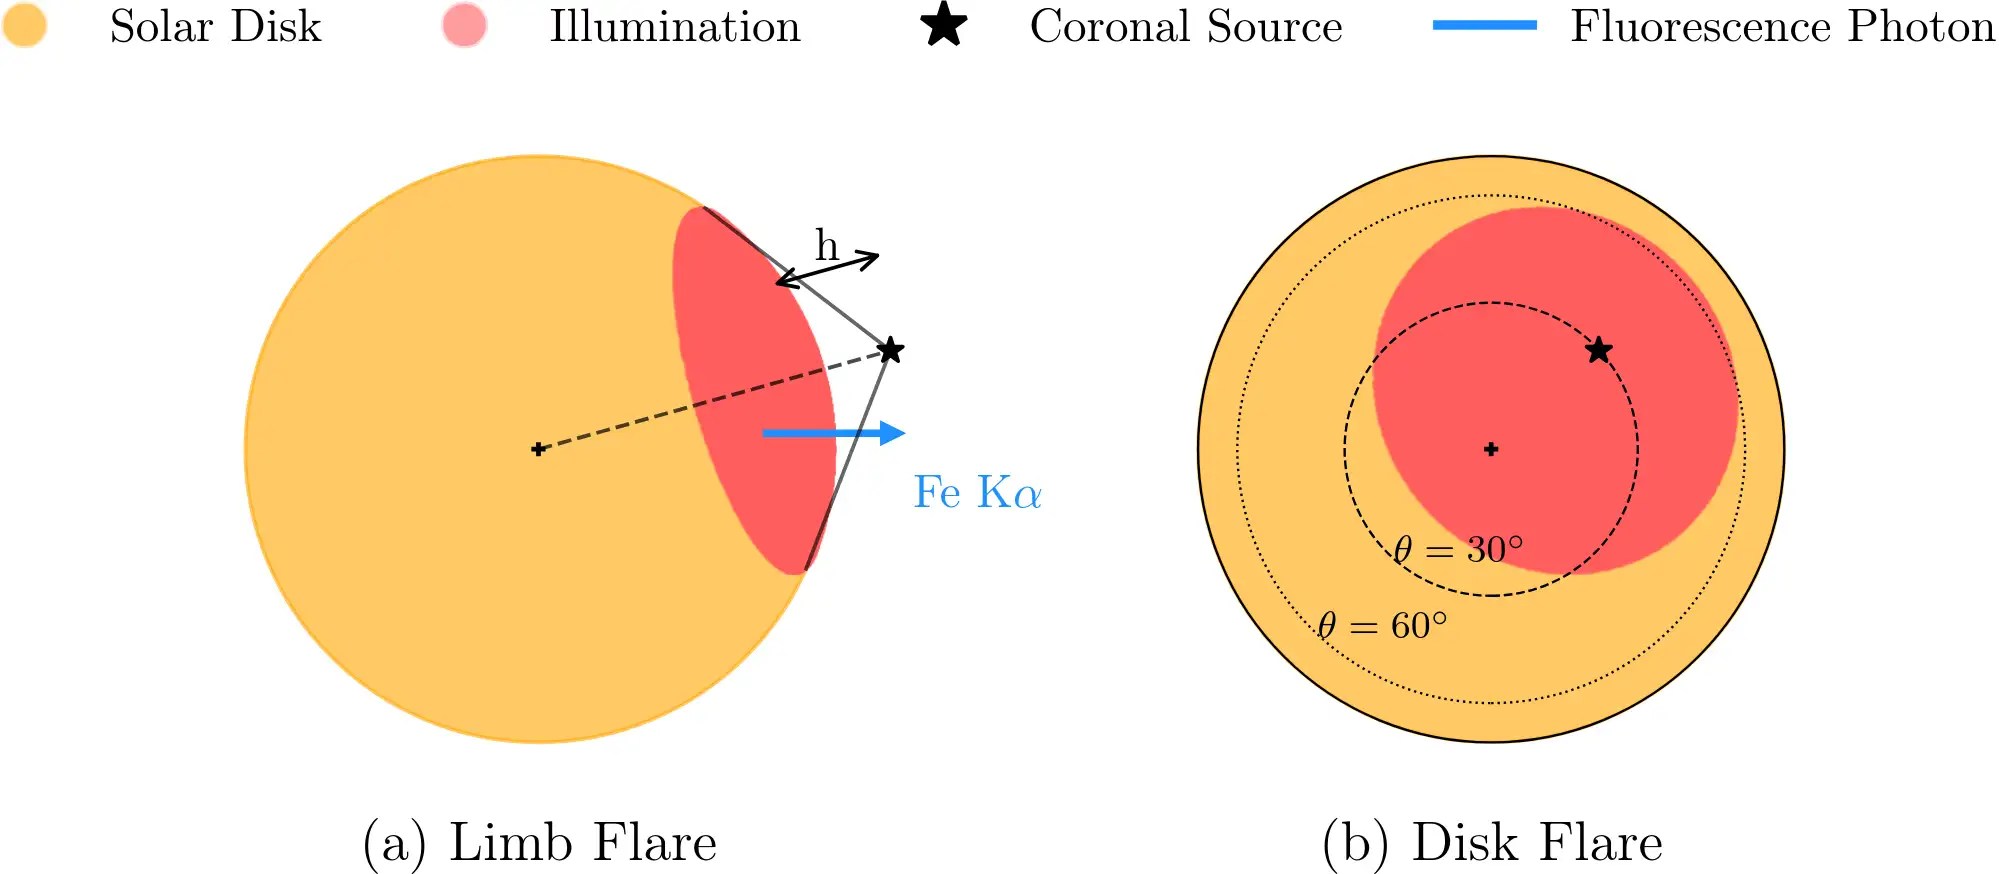
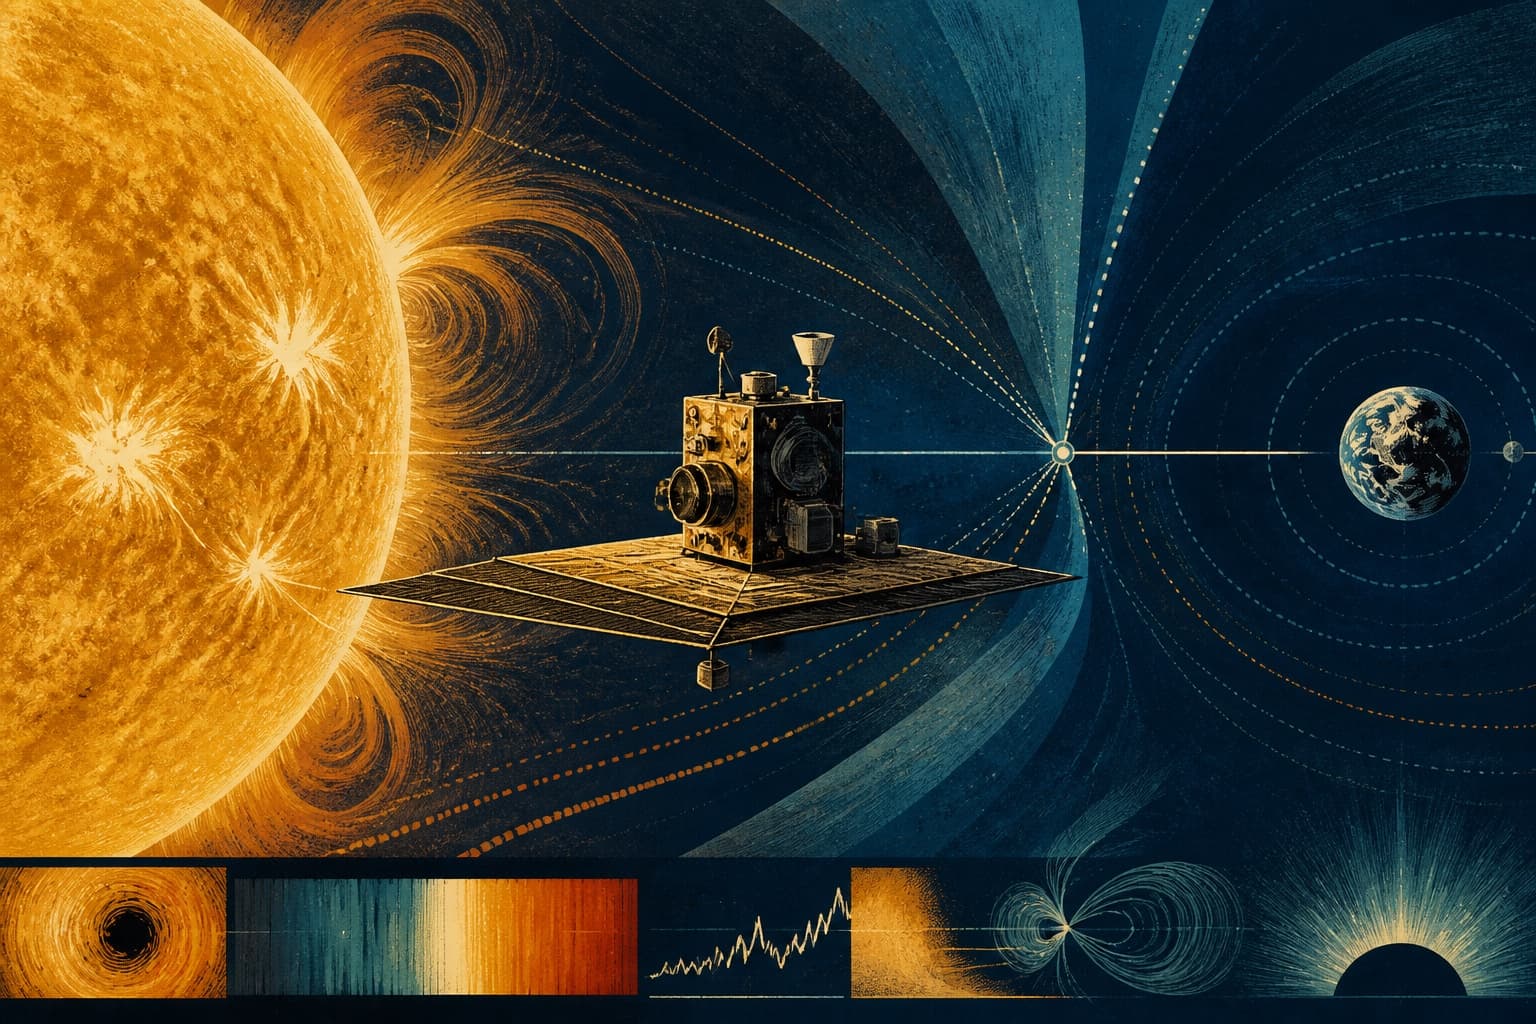
A faint X-ray signal from neutral iron on the Sun's visible surface has given India's Aditya-L1 observatory a new way to examine the geometry of major solar flares. Researchers using the spacecraft's Solar Low Energy X-ray Spectrometer, or SoLEXS, report that the 6.40 kilo-electron-volt signal followed the energetic X-rays produced in the corona and weakened sharply as flare locations approached the edge of the solar disk. The result, drawn from 47 X-class flares observed in 2024, makes the signal a potential constraint on where a flare's coronal X-ray source sits above the photosphere.
An X-ray echo from the photosphere
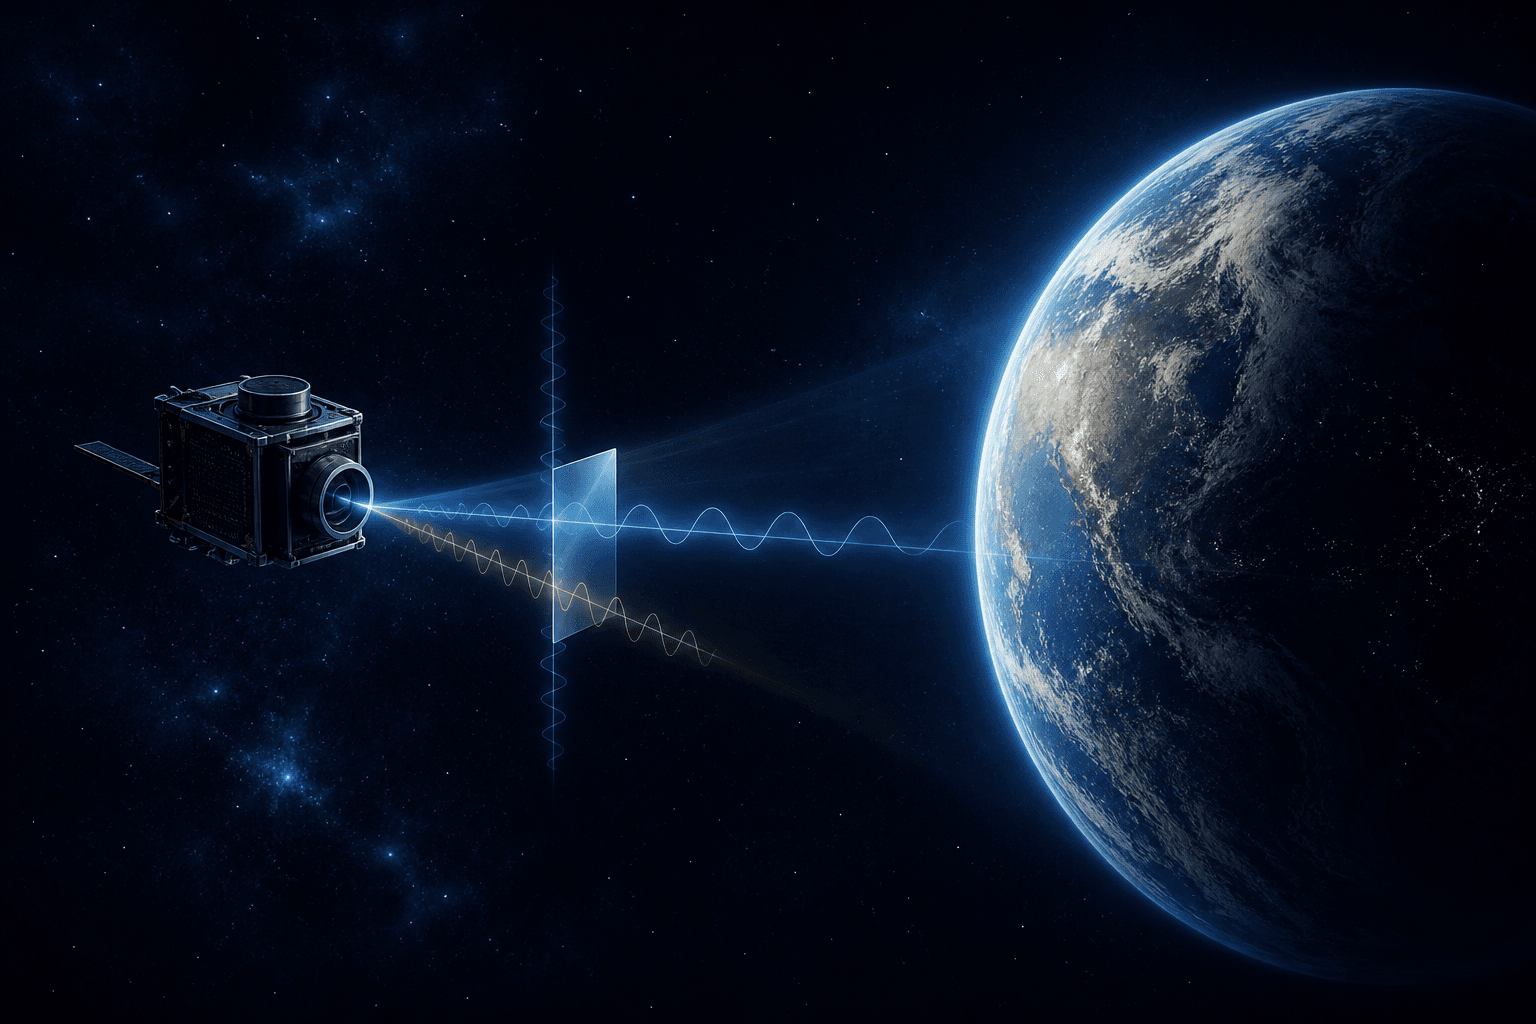
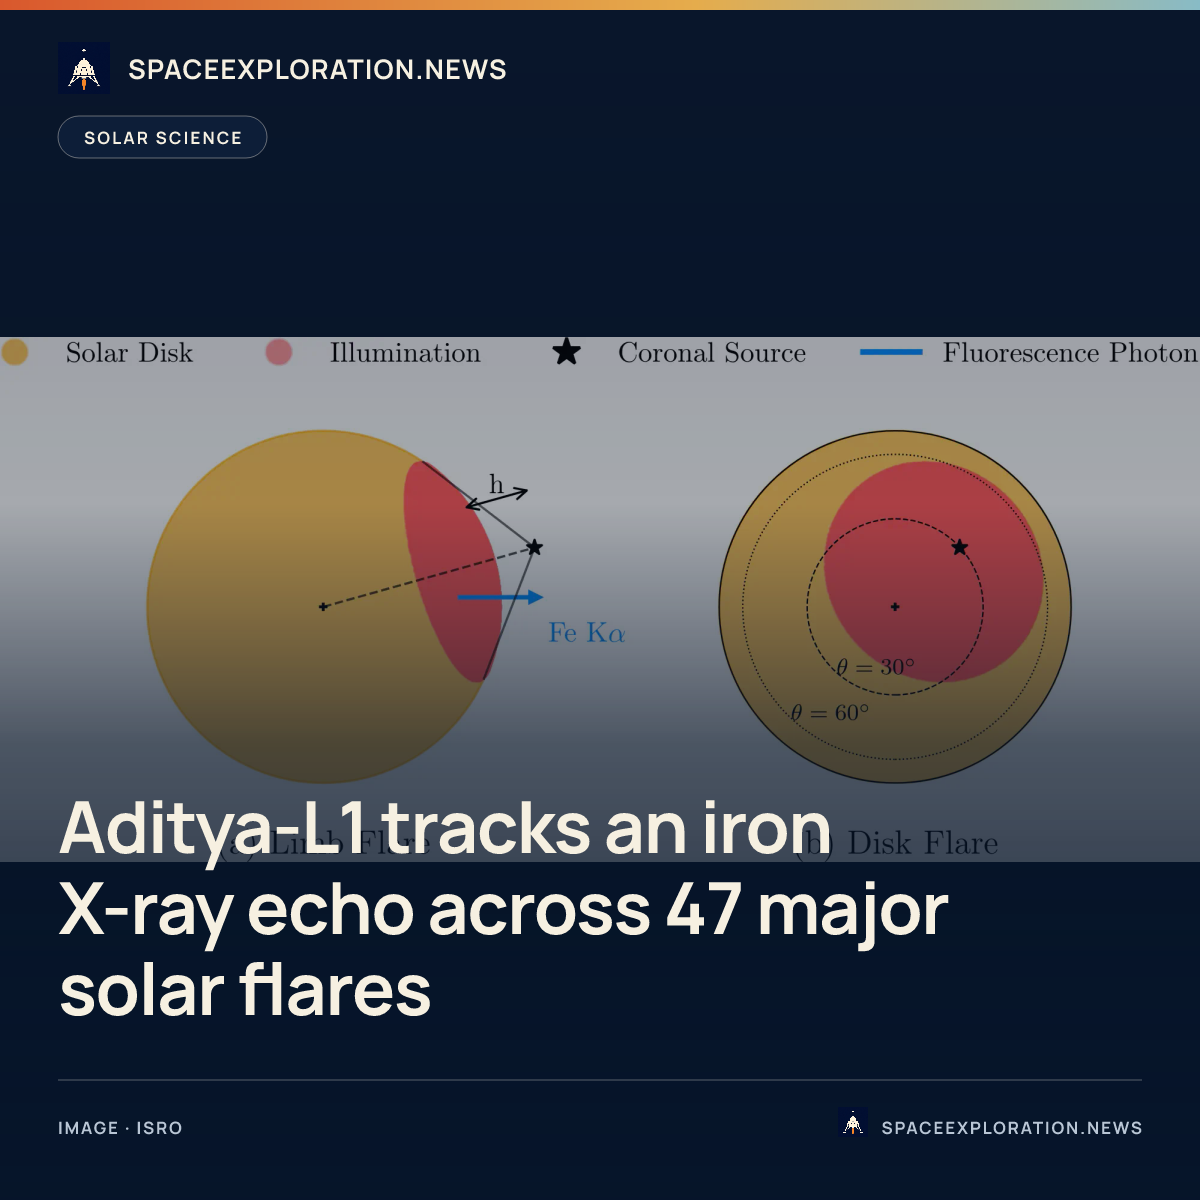
The mechanism begins above the Sun's surface. A powerful flare heats coronal plasma to temperatures of tens of millions of kelvin, producing a broad spectrum of X-rays. Some photons travel downward instead of escaping into space. Photons carrying more than 7.11 keV can remove an electron from the innermost shell of a neutral or weakly ionised iron atom in the photosphere. When another electron fills that vacancy, the atom emits a characteristic iron K-alpha photon at 6.40 keV. The fluorescent photon is therefore an indirect response to the flare's higher-energy coronal emission rather than another line made inside the hot flare plasma.
SoLEXS can measure both sides of that interaction at once: the iron K-alpha line and the continuum of photons above the 7.11 keV excitation threshold. Earlier narrow-band crystal spectrometers resolved iron lines more finely, but the study says they could not simultaneously measure the broadband exciting flux and therefore had to estimate it through models. SoLEXS uses silicon drift detectors with about 170 eV spectral resolution near 6 keV, lower than a crystal spectrometer but broad enough in energy coverage to calculate fluorescence efficiency directly. Its smaller-aperture detector is intended to handle intense M- and X-class flares without saturating.
Why the flare sample matters
The team began with 54 X-class flares recorded during 2024, the first year of SoLEXS science operations and a highly active period in Solar Cycle 25. After applying detector-quality and valid-observing-time requirements, it retained 47 events. All of the analysis used the instrument's smaller-aperture detector because the high photon rates frequently saturated its companion detector. The selected flares also covered the face of the Sun: 13 were within 30 degrees of disk centre, 15 lay between 30 and 60 degrees, and 19 were between 60 and 90 degrees, near the limb. That spread allowed the researchers to test a geometrical prediction rather than infer it from only a few similarly placed events.
For each flare, the researchers fitted the X-ray spectrum to separate the hot thermal emission, the 6.40 keV fluorescence feature and nearby line complexes. They also checked whether the apparent feature could instead come from the instrument or from cooler plasma. Closed-aperture background observations showed no significant residual at 6.40 keV, while modelling of lower-ionisation iron lines found that those lines were too weak to explain the measured excess. In the flare sample, the K-alpha flux tracked the flux above 7.11 keV during the thermal phase, supporting excitation by coronal X-ray photons as the dominant mechanism in the statistical result.
The contrast between two example events shows the scale of the viewing effect. For an X1.0 flare at a heliocentric angle of 29 degrees on June 1, 2024, the mean observed fluorescence efficiency around the peak was 0.05025, with a statistical uncertainty of 0.00374. An X1.2 flare close to the limb at 89 degrees on May 14 produced an efficiency of 0.00678, with an uncertainty of 0.00179, despite having comparable exciting flux. Across the full sample, efficiency generally fell from disk centre toward the limb, as models predict when fluorescent photons from the photosphere must travel through more material to reach the observer.
A geometric diagnostic, with a degeneracy
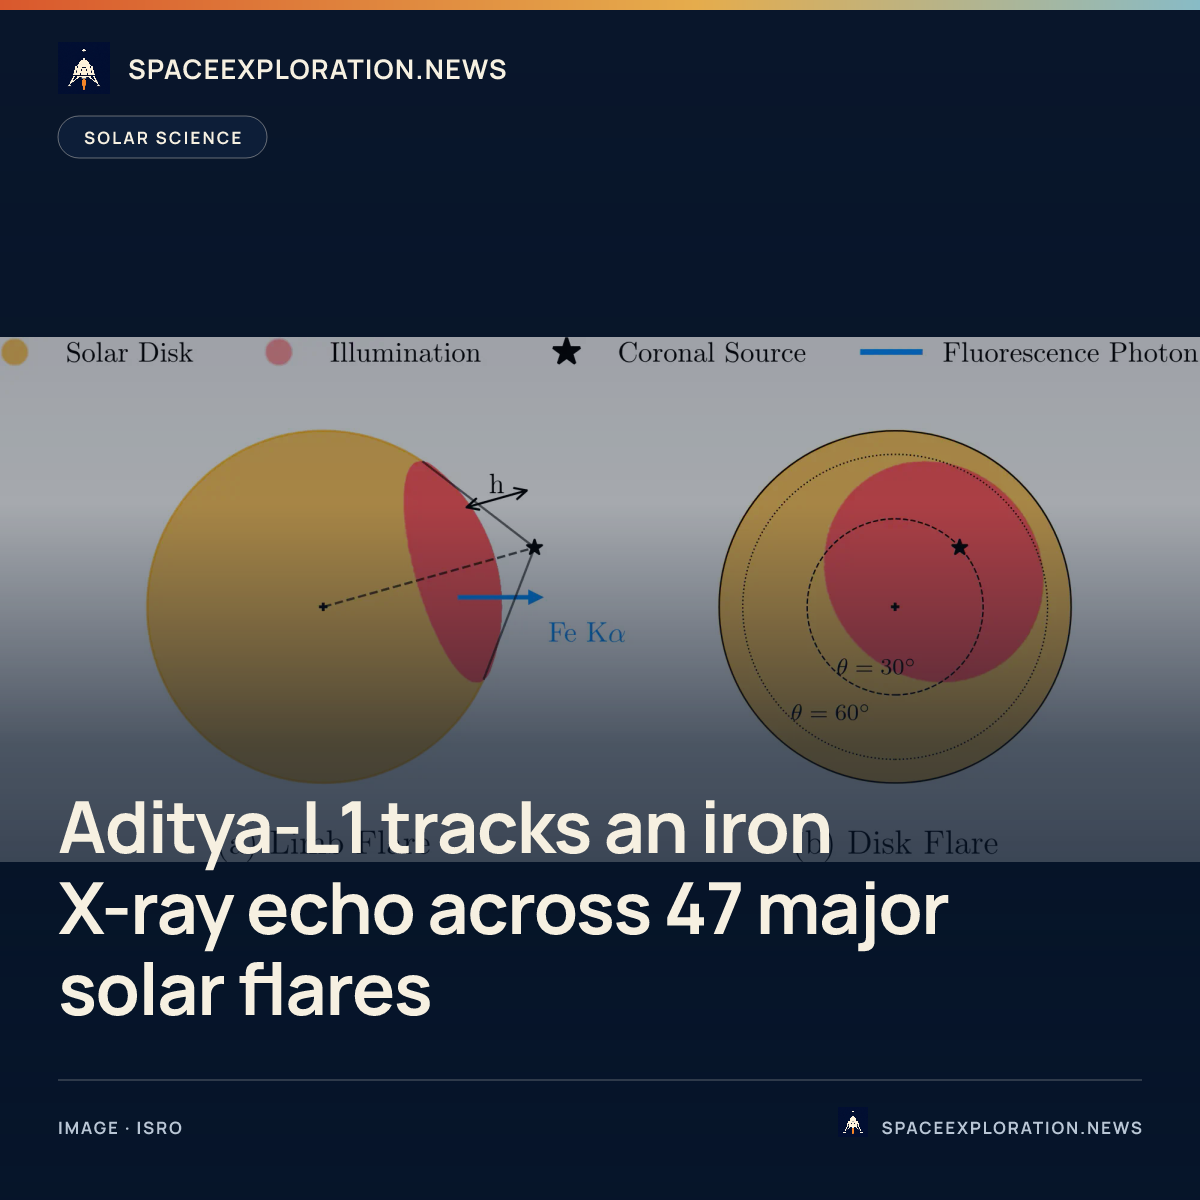
Source height also changes the signal. A coronal source close to the photosphere illuminates a larger solid angle of the surface than a source high above it, while the depth and direction at which photons enter the photosphere affect how many fluorescent photons escape toward the observer. That makes fluorescence efficiency sensitive to both height and viewing angle. To reduce the separate effect of temperature, the team compared 34 flares during decay intervals when their fitted plasma temperatures were between 18.5 and 21.5 million kelvin. The resulting centre-to-limb curve agreed with the theoretical framework used in the paper.
A height estimate is not unique, however, because the same efficiency also depends on how much iron is assumed to be in the photosphere. The curves that produced physically realistic source heights in this analysis used an iron abundance of 5.5 × 10^-5, above the modern photospheric value of 3.16 × 10^-5 cited by the authors. Height and abundance cannot be separated from the fluorescence measurement alone. The model also treats the source as a simple coronal point, while extended flare loops, local abundance differences or other excitation processes can move individual events away from the average curve. Those qualifications make the method a constraint on effective geometry, not a direct altitude measurement for every flare.
Precision places a second limit on the method. The paper reports a time-averaged uncertainty of about 0.003 in fluorescence efficiency, corresponding in its model to a source-height difference of roughly 0.01 solar radii for a 20-million-kelvin source at disk centre when iron abundance is fixed. Individual 10-second time bins were much less precise, with uncertainties near 0.015, so the present data cannot reliably follow rapid height changes during a flare. Averaging around the flare peak can constrain a mean effective height more tightly, particularly for events closer to disk centre, but it does not remove the abundance degeneracy.
What the result does—and does not—show
The study is a measurement of flare radiation and geometry, not a demonstration of improved space-weather forecasting. Neither the paper nor ISRO's July 3 summary reports a forecast test, an earlier warning time or a prediction system based on the 6.40 keV line. The immediate advance is narrower: SoLEXS can use one broadband detector system to measure the exciting X-rays and their photospheric fluorescent response, then compare that ratio across the solar disk. Any forecasting application would require separate evidence connecting the diagnostic to predictive performance.
The authors propose extending the work to the more numerous M- and C-class flares, which could define the centre-to-limb relation with a larger sample. They also identify instrumental paths to better measurements: more effective collecting area without saturation, and spectral resolution near 125 eV to separate the neutral iron line more cleanly from the hot iron complex. For now, the 47 X-class events establish the population-level pattern and its limits. The next test is whether a larger and more precise SoLEXS record can turn that pattern into reliable constraints for individual flare geometries.
Reporting trail
Primary sources
For an image post, download the card and copy this suggested caption.
The 6.40 keV signal tracked flare X-rays and weakened toward the solar limb, giving SoLEXS a possible way to constrain coronal source geometry—with important limits. Read the full report: https://www.spaceexploration.in/news/aditya-l1-iron-fluorescence-solar-flares #SpaceExplorationNews #SpaceNews #SpaceScience