Science
COFFIES model tests early detection of solar active-region emergence
The machine-learning model uses acoustic-power changes and weak magnetic signals to project solar-surface brightness 12 hours ahead, but the result is not yet a real-time solar-storm forecast.
Add us as a preferred source on Google Add us as a preferred source on Google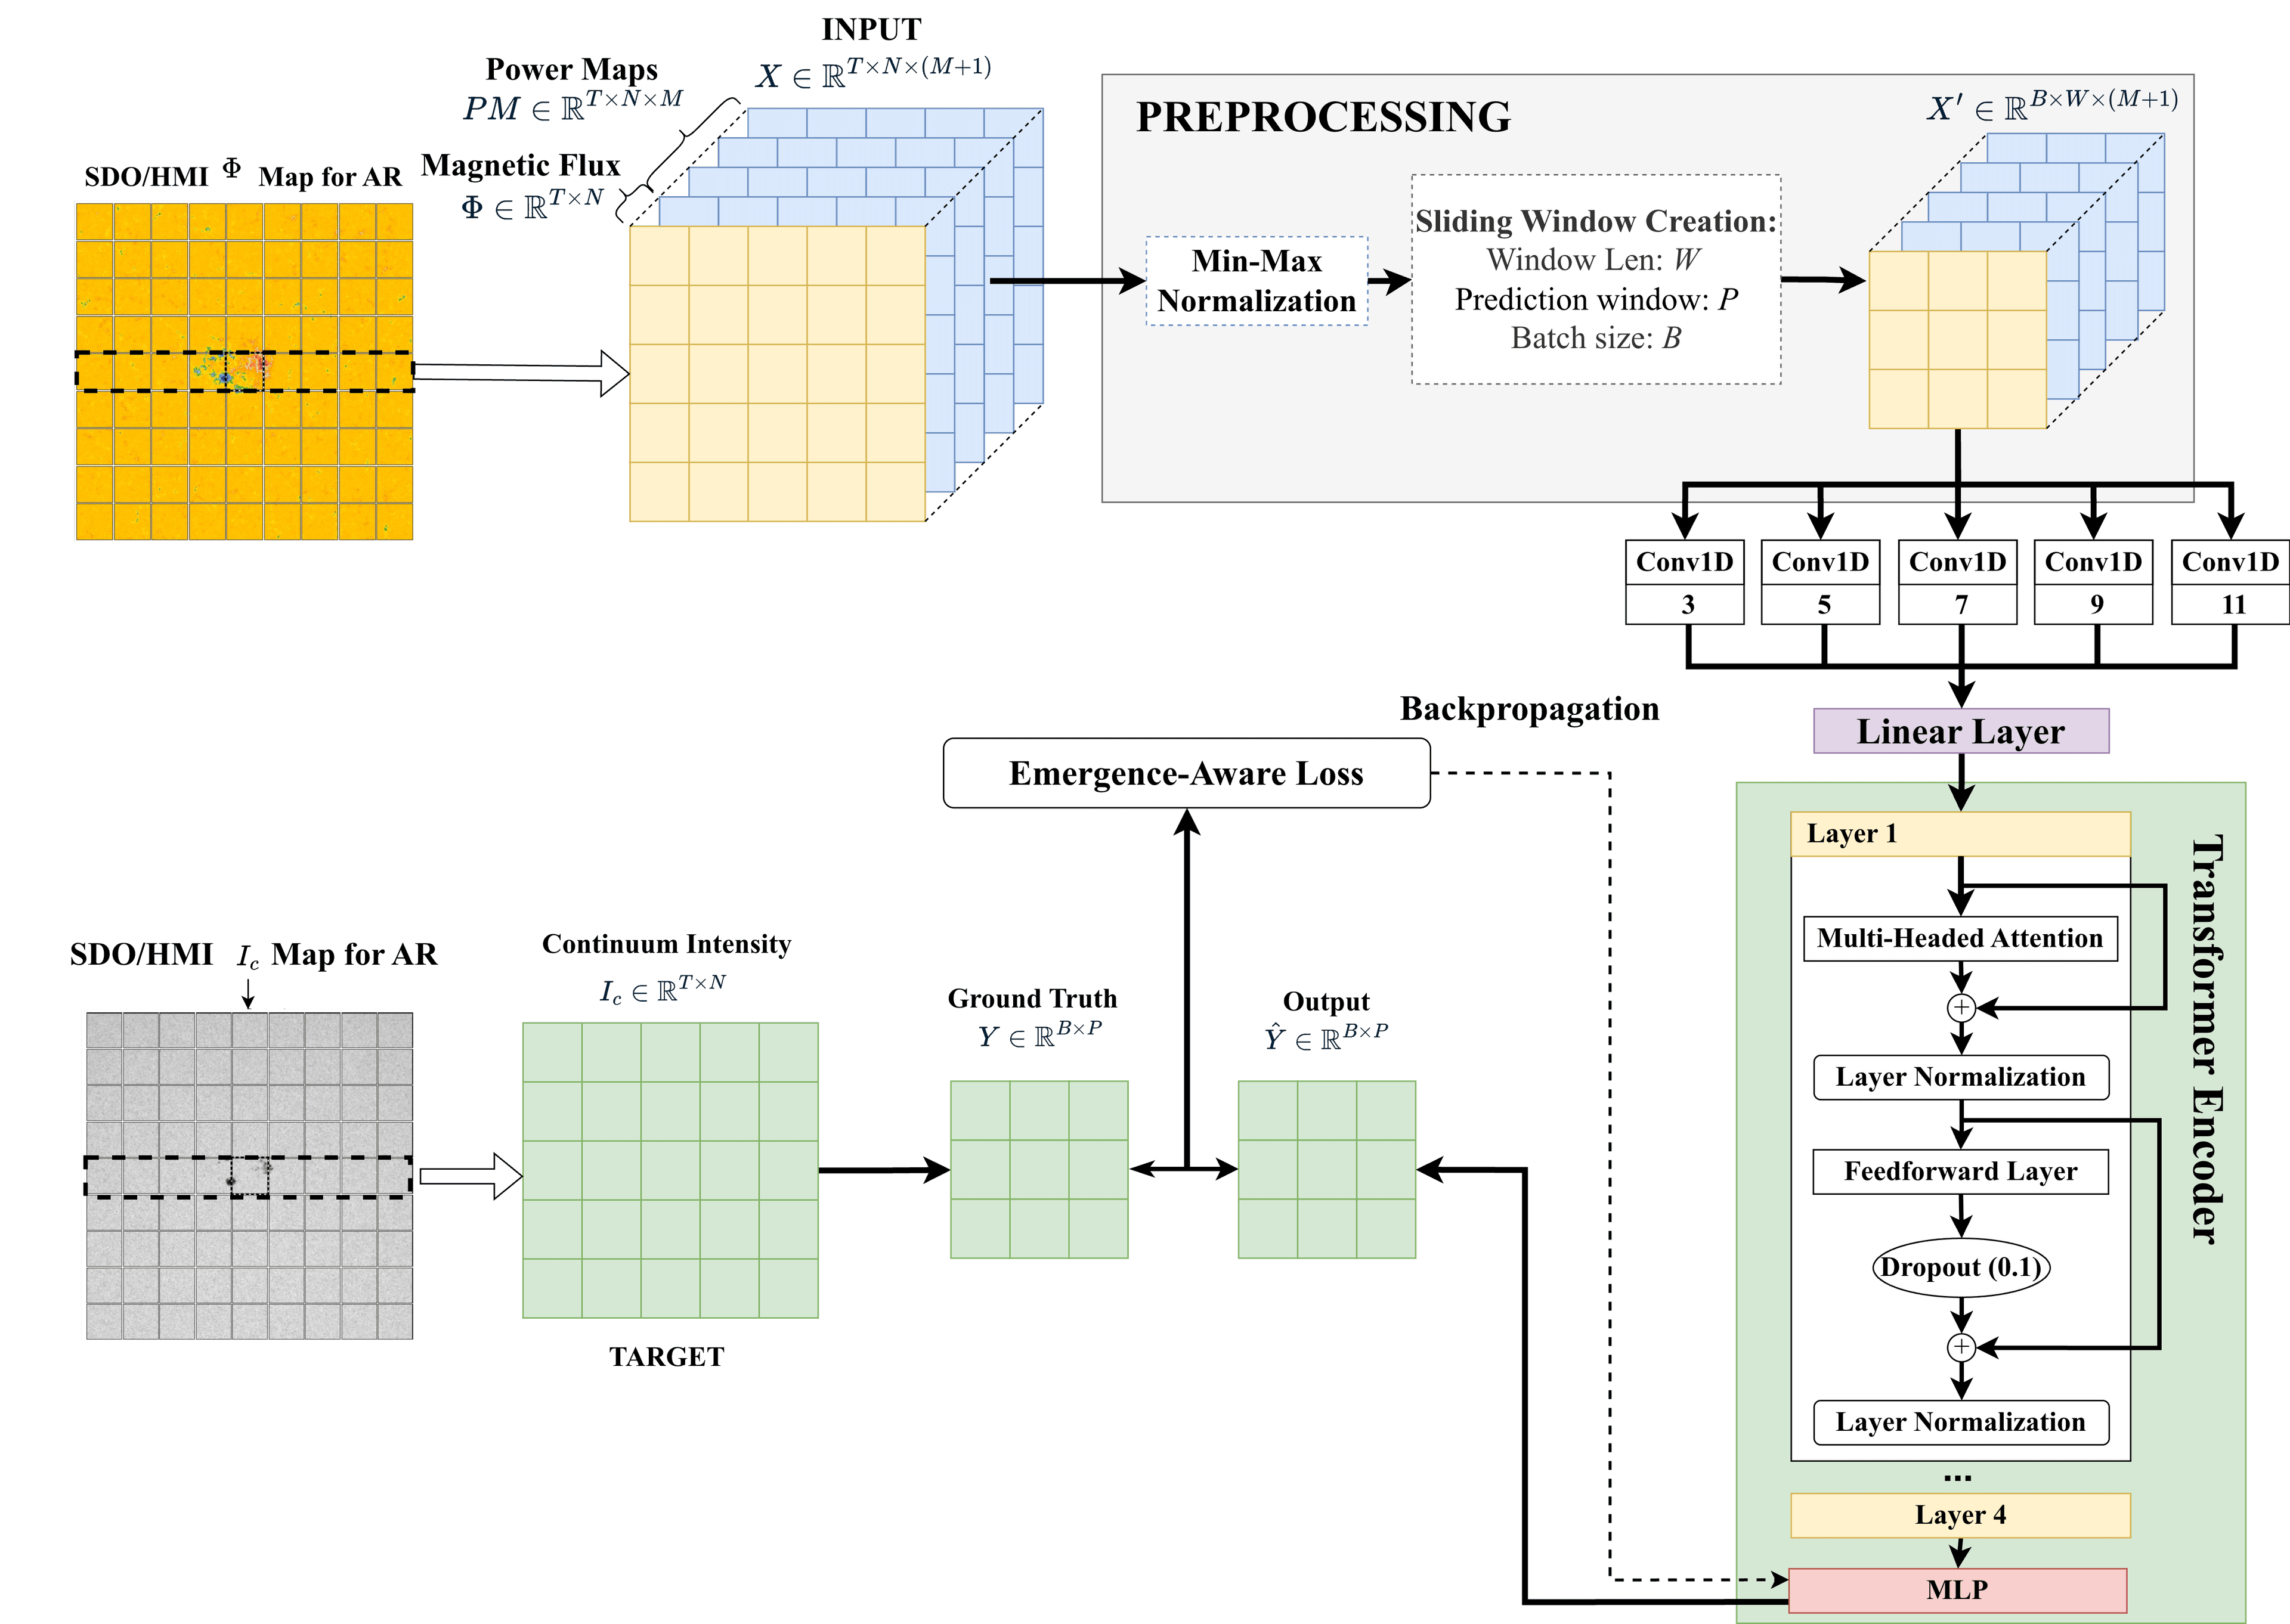
A team from NASA’s Consequence Of Fields and Flows in the Interior and Exterior of the Sun (COFFIES) science centre has tested a machine-learning model that estimates when and where large solar active regions will begin appearing at the Sun’s visible surface. The peer-reviewed study was published on August 14. Its results come from historical Solar Dynamics Observatory data, not a live forecasting service, and the authors do not show that the model can predict whether an emerging region will later produce a flare or coronal mass ejection.
That distinction matters because active-region emergence sits upstream of a space-weather event. The model’s target is continuum intensity, the visible-light brightness measured by the Solar Dynamics Observatory’s Helioseismic and Magnetic Imager (HMI). A sustained fall in that intensity is used as a marker that magnetic flux is emerging and a darker sunspot-forming region is taking shape. Predicting that fall can identify an approximate patch of the solar surface early; it does not by itself forecast an eruption, its strength or its effect at Earth.
The signals ahead of a new sunspot
The underlying Solar Active Region Emergence Dataset, or SolARED, begins with Doppler velocity, line-of-sight magnetic-field and continuum-intensity maps from HMI. It contains 50 large active regions observed between 2010 and 2023. Each region was followed for 10 days in a 30.66-by-30.66-degree patch, then divided into a 9-by-9 grid. Averaging the measurements inside each tile turns the images into one-dimensional time series that a sequence model can process. Four regions were excluded from the Transformer study because of data gaps or quality problems, leaving 46.
The Doppler measurements supply the acoustic part of the signal. Researchers convert eight-hour runs of surface-velocity observations into acoustic-power maps in four frequency bands: 2–3, 3–4, 4–5 and 5–6 millihertz. Rising magnetic flux can alter the local magnetic field and the pattern of waves and convection near the surface before a spot becomes apparent in a continuum image. HMI does not directly see the buried magnetic structure, so these are indirect precursors. The model is also given the line-of-sight magnetic field, meaning it is looking for a combination of faint acoustic and already detectable magnetic changes rather than an invisible region with no observational trace.
For each forecast, a Transformer — a neural network designed to compare relationships across a sequence — reads a 110-hour record containing those four acoustic-power channels and the magnetic-field channel. A sliding window advances through the record one hour at a time, and the model projects the next 12 hours of continuum intensity. The best variant, called EarlyDetect, deliberately gives more weight to early parts of the sequence and uses a loss function that penalises a late predicted intensity drop more strongly than a premature one. A separate convolutional front end was tested, but it tended to smooth away the small changes important for timing; the strongest aggregate results came from EarlyDetect without that layer.
What the 12-hour result means
NASA’s statement that the model works up to 12 hours ahead describes the future interval covered by each model output. It should not be read as a guaranteed 12-hour warning for every active region. In the final journal evaluation, EarlyDetect’s mean onset lead time across valid tile cases was 9.24 hours and its median was six hours. The pooled standard deviation was 33.19 hours, substantially wider than the average itself, showing that the headline mean sits alongside large early and late timing errors.
The evaluation was small. Of the 46 usable active regions, 41 formed the training and validation set and five were held out for testing. Four of those five test regions had a mean EarlyDetect lead time inside the paper’s zero-to-24-hour success window. At the finer tile level, however, its table records nine true positives and 11 true negatives among 35 selected central-tile cases. The other 15 cases comprised predictions that were too early, false alerts on quiet tiles, late detections or no alert. The older long short-term memory baseline logged 12 tile-level true positives, although EarlyDetect had the higher mean lead time and fewer emergence tiles with no alert.
The paper also separates the forecast horizon from processing delay. It cites roughly four hours of latency in the existing Dopplergram-processing pipeline and says a 12-hour projection could therefore leave about eight hours of theoretical operational visibility. That estimate is not a measured end-to-end warning time. A deployed service would still have to account for data arrival cadence, gaps and human review, none of which was evaluated in the reported onset statistics.
Why this is not yet a space-weather forecast
The held-out data did not simulate an unrestricted, real-time scan of the entire Sun. The researchers began with five known emergence events and reported selected rows of tiles around their primary flux-emergence sites. That design tests whether the architecture can recover precursor timing in curated historical cases, but it does not establish a full-disc false-alarm rate. The authors also used one fixed train-test split rather than repeated cross-validation and say the sample has limited representation of highly flare-productive magnetic complexity classes.
There is a second boundary between finding an active region and forecasting hazardous activity from it. The study predicts an intensity decrease associated with emergence; it does not predict a solar flare, coronal mass ejection, energetic-particle event or geoeffect. NASA says current operational forecasters at the US National Oceanic and Atmospheric Administration’s Space Weather Prediction Center and the US Air Force monitor regions that are already visible and use their characteristics to estimate flare probabilities. NASA also states explicitly that the COFFIES model is not ready for operational real-time forecasting.
The authors propose testing larger and more diverse samples, changing the train-test partition, adding spatial information from neighbouring tiles and moving from continuum intensity toward direct forecasts of magnetic-flux emergence. Those steps would have to be followed by live full-disc evaluation and integration with an operational data pipeline before the approach could support warnings. For now, the demonstrated result is narrower: a Transformer extracted timing and approximate-location information from acoustic and magnetic patterns before a visible intensity drop in a small set of historical active regions.
Reporting trail
Primary sources
NASANASA’s COFFIES Uses AI to Predict Storm-Causing Active Regions on Sunscience.nasa.gov
Journal of Geophysical Research: Machine Learning and ComputationForecasting Continuum Intensity for Solar Active Region Emergence Prediction Using Transformersagupubs.onlinelibrary.wiley.com
Solar PhysicsSolARED: Solar Active Region Emergence Dataset for Machine Learning Aided Predictionslink.springer.com
For an image post, download the card and copy this suggested caption.
The machine-learning model uses acoustic-power changes and weak magnetic signals to project solar-surface brightness 12 hours ahead, but the result is not yet a real-time solar-storm forecast. Read the full report: https://www.spaceexploration.in/news/coffies-active-region-early-detection #SpaceExplorationNews #SpaceNews #SpaceScience